Download
1 / 29
360 likes | 727 Vues
Application of GIS on Landslide Susceptibility and risk mapping. Pradeep Paudyal [2009422004] Hydrogeology Lab. Department of Geology Kyungpook National University. Landslide. A generalized / collective name for mass movement activities on the earth surface

E N D
Application of GIS on Landslide Susceptibility and risk mapping PradeepPaudyal [2009422004] Hydrogeology Lab. Department of Geology Kyungpook National University
Landslide • A generalized / collective name for mass movement activities on the earth surface • Slide (rock slide, soil slide, mud slide) • Fall (rock fall, soil fall) • Topple • Flows (debris flows, mud flows)
Causative factors for Landslide • Natural causes: • Slope of terrain • Faces of sloped surface (aspect) • Direction to the sun (hillshade) • Rock /soil type and depth • Intensity of rainfall • River works and drainage pattern, etc. • Anthropogenic causes: • Road cut / quarrying on mountain terrain • Changing land use pattern and deforestation, etc.
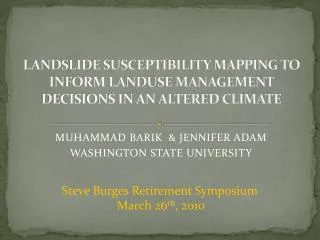
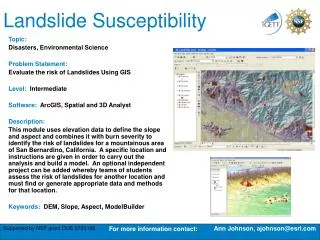
Landslide susceptibility • Landslide susceptibility is defined as a possibility of occurrence of landslide in a particular area once upon a time in future • Landslide susceptibility mapping delineates the hazardous zones due to occurrence of landslides • The present study is focused on preparation of landslide susceptibility map with an application of geographic information system (GIS)
Study area • Southwest part of Kathmandu (capital of Nepal) • It covers some part of middle mountains and flat land of Kathmandu valley CHINA NEPAL INDIA
Distribution of Landslides • About 125 landslides are mapped to prepare the landslide susceptibility map. • Landslides only greater than 25 m x 25 m dimension are considered • Most of landslides are distributed on the north-faced slope of hilly terrain
Susceptibility parameter maps • Slope map • Aspect map • Hillshade map • Geological map • Distance to stream map
Slope map • Slope map comprises 6 classes of slopes measured in degree gradient • Areal distribution of slope map shows:
Aspect map • Aspect map is a measure of slope faces reference to the north direction • Aspect map comprises 10 classes including flat land as aspect zero. • The aspect map was reclassified into 6 classes as:
Hillshade map • Hillshade map is a measure of direction and altitude of sun to the sloping face • It reflects a gradient value of hillshade, which is later categorized into 6 classes during map analysis
Geological map • Due to very high importance of rock type in occurrence of landslide, a geological map of study area has also been considered • The geological map shows 6 different rock units:
Distance to stream map • Streams have also vital role on inducing landslides; close to a stream has a high possibility of landslide occurrence • Streams are buffered and classified into 6 classes:
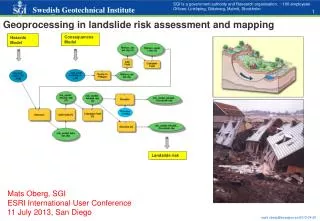
Methodology and Analysis • “Landslide Index Method” is used to calculate the respective weights for landslide susceptibility mapping wi= weight given to a certain parameter class, Dense class = landslide density within the parameter class, Dense map = landslide density within the entire map, Npix (Si) = number of pixels containing landslide in a certain parameter class, and Npix (Ni) = total number of pixels in a certain parameter class.
Methodology and Analysis • Weights obtained using LI method
Result • Each parameter maps are overlaid and the respective weights are summed up as: • A resultant landslide susceptibility map is obtained with a range of value, which is categorized into 3 classes: High, Medium, and Low susceptibility • This categorization is in a subjective way Weight= [Wslope + Wasp +Whillshade+ Wstreamdis+ Wgeol]
Validity Test • About 25% of landslides were separated for validation test of the prepared landslide susceptibility map. • The test shows 18 landslides out of 25 lie in the high hazard zone, while rest 5 landslides lie in the moderate and 2 lie in the low hazard zone respectively.
Risk assessment • Risk is a measure of loss of life and properties. • By crossing the layer of landslide susceptibility and settlement, about 250 residential houses are under high hazard zone. • Considering information about average household size of 10 person per house, 2500 people are under high vulnerable zone due to landslides.
Conclusions • GIS is very useful tool that can be applied in building a statistical model in the field of natural science too if spatial information are available. • GIS can link the socioeconomic and demographic attributes to the spatial information that becomes helpful in policy making and planning.