Download
1 / 62
1.73k likes | 5k Vues
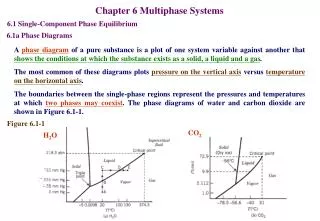
Chapter 6 Multiphase Systems. 6.1 Single-Component Phase Equilibrium. 6.1a Phase Diagrams. A phase diagram of a pure substance is a plot of one system variable against another that shows the conditions at which the substance exists as a solid, a liquid and a gas .

E N D
Chapter 6 Multiphase Systems 6.1 Single-Component Phase Equilibrium 6.1a Phase Diagrams A phase diagram of a pure substance is a plot of one system variable against another that shows the conditions at which the substance exists as a solid, a liquid and a gas. The most common of these diagrams plots pressure on the vertical axis versus temperature on the horizontal axis. The boundaries between the single-phase regions represent the pressures and temperatures at which two phases may coexist. The phase diagrams of water and carbon dioxide are shown in Figure 6.1-1. Figure 6.1-1 CO2 H2O
What the phase diagram means and what can be done with it are illustrated by a hypothetical experiment in which pure water is placed in a leakproof evacuated cylinder fitted with a movable piston, as shown in the diagram right. Heat can be added to or withdrawn from the cylinder, so that the temperature in the chamber can be adjusted to any desired value. The absolute pressure of the cylinder contents [which equals (F+W)/A, where W is the weight of the piston] can similarly be adjusted by varying the force F on the piston.
Notice that the phase transitions – condensation at point B and evaporation at point D – take place at boundaries on the phase diagram; the system cannot move off these boundaries until the transitions are complete.
Several familiar terms may be defined with reference to the phase diagram. 1.If T and P correspond to a point on the vapor-liquid equilibrium curve (TTc) for a substance, P is the vapor temperature of the substance at temperature T, and T is the boiling point (more precisely, the boiling point temperature) of the substance at pressure P. 2.The boiling point of a substance at P = 1 atm is the normal boiling point of that substance. 3.If (T, P) falls on the solid-liquid equilibrium curve (TC), then T is the melting point or freezing point at temperature P.
4.If (T, P) falls on the solid-vapor equilibrium curve (TA),then P is the vapor pressure of the solid at temperature T, and T is the sublimation point at temperature P. 5.The point (T, P) at which solid, liquid, vapor phases can all coexist is called the triple point (Tc) of the substance. 6.The vapor-liquid equilibrium curve terminates at the critical temperature and critical temperature (Tc and Pc). Above and to the right of the critical point, two separate phases never coexist.
The freezing point of water decreases with increasing pressure. This behavior is extremely unusual; most substance, including carbon dioxide, exhibit the opposite behavior. Note also, however, that the changes are very slight; the solid-liquid equilibrium curves are in fact nearly vertical. Normal boiling and melting points for many substances are given in Table B.1 and for many more substances on pp. 2-7 through 2-47 of Perry’s Chemical Engineers’ Handbook, and vapor pressures are tabulated on pp. 2-48 through 2-75 of the handbook. Test Yourself p. 243
6.1b Estimation of Vapor Pressures The volatility of a species is the degree to which the species tends to transfer from the liquid (or solid) state to the vapor state. At a given temperature and pressure, a highly volatile substance is much more likely to be found as a vapor than is a substance with low volatility, which is more likely to be found in a condensed phase (liquid or solid). Separation processes such as distillation are used to separate more volatile species from less volatile species by partially vaporizing liquid mixtures. The vapor product is relatively rich in the more volatile feed components and the residual liquid is rich in the components with lower volatility. The vapor pressure (p*) of a species is a measure of its volatility: the higher the vapor pressure at a given temperature, the greater the volatility of the species at that temperature.
A relationship between p*, the vapor pressure of a pure substance, and T, the absolute temperature, is the Clapeyron equation T is absolute temperature and are the specific molar volume (volume/mole) of gas (vapor) and liquid, respectively is the latent heat of vaporization Clausius-Clapeyron equation Tables of p* at different temperatures exist for many species, but it is difficult to interpolate between tabulated values since p* varies sharply with T. Plots of p* versus T for different species would not be particularly useful since closely spaced data points would be required to generate each plot, and the curvature of the plots would make it awkward to show data for many different species on a single graph.
Example 6.1-1 The vapor pressure of benzene is measured at two temperatures, with the following results: Calculate the latent heat of vaporization and the parameter B in the Clausius-Clapeyron equation and then estimate p* at 42.2C using this equation. Solution exp. 200 mm Hg exp. 31,000J/mol
Fortunately, while the temperature dependence of vapor pressure may be highly nonlinear, the logarithm of p* varies with T in roughly the same way for a large number of species. A log plot of the vapor pressure of a species at a given temperature versus the vapor pressure of a reference species at the same temperature consequently tends to be linear. This observation give rise to the equal-temperature reference-substance plot. Figure 6.1-2 If you have values of p* for a species at two or more temperatures, you can look up the vapor pressure of a reference substance (usually water) at the same temperature and plot p*(T) versus pref*(T) on log axes. You can draw a straight line through the points plotted in this manner, and then, with fair accuracy, use the plot to estimate p* for any temperature from the known value of pref* at the same temperature, as shown in Figure 6.1-2.
An additional step is normally taken in the construction of plots of this type. The usual use of the plot is to determine p* for a given T; pref* is only an intermediate quantity used to relate these variables. The necessity of looking up pref* for each given temperature can be avoided if values of T(pref*) are shown on a second abscissa scale. Now to find p*(T) you need only find T on the new abscissa scale; the value of pref*(T) will be located at the same abscissa value, and the curve of p* versus pref* may then be used to determine p*(T). Figure 6.1-3 Notice, however, that there is no longer a need for the pref* scale, since once you find T on the abscissa you can proceed directly to the curve. The pref* scale can therefore be omitted, leaving what has come to be called a Cox chart – log p* on the ordinate and the temperature scale on the abscissa, as shown in Figure 6.1-3.
Special graph paper – sometimes called vapor pressure paper – that has these coordinate axes is available commercially. Cox chart plots for various substances are shown in Figure 6.1-4. Figure 6.1-4 It is also possible to get straight-line correlations with Duhring plots, which are plots of the temperature at which a substance has a certain vapor pressure versus the temperature at which a reference substance has the same vapor pressure. A relatively simple empirical equation that correlates vapor pressure – temperature data extremely well is the Antoine equation Values of A, B, and C for several compounds are listed in Table B.4. Test Yourself p. 246
6.2 The Gibbs Phase Rule The variables that describe the condition of a process system fall into two categories: extensive variables, which depend on the size of the system, and intensive variables, which do not. Mass and volume are examples of extensive variables; intensive variables include temperature, pressure, density and specific volume, and mass and mole fractions of individual system components in each phase. The number of intensive variables that can be specified independentlyfor a system at equilibrium is called the degree of freedom of the system. If no reactions occur among the system components, the phase rule is If r independent reactions occur among the system components and the reactions proceed to equilibrium, then the right-hand side of this equation must be reduced by r. In the Gibbs phase rule, the degrees of freedom equals the number of intensive variables that must be specified for a system at equilibrium before the remaining intensive variables can be calculated.
Example 6.2-1 Determine the degrees of freedom for each of the following systems at equilibrium. Specify a feasible set of independent variables for each system. Solution 1.Pure liquid water Two intensive variables must be specified to fix the state of the system, for example, T and P. Once these variables have been specified, other intensive variables such as density and viscosity may be determined. 2.A mixture of liquid, solid, and vapor water No further information about the system may be specified and all intensive variables are fixed.
3.A vapor-liquid mixture of acetone and methyl ethyl ketone Two variables must be specified to fix the state of the system. For example, setting T and P fixes the acetone and MEK mole fractions in both the vapor and liquid phases. Alternatively, T and the acetone mole fraction in the vapor may be specified, and P and the acetone mole fraction in the liquid are then fixed. Test Yourself p. 249
6.3 Gas-Liquid Systems: One Condensable Component Systems containing several components, of which only one is capable of existing as a liquid at the process conditions, are common in industrial processes. Separation processes that involve such systems include evaporation, drying, and humidification – all of which involve transfer of liquid into the gas phase – and condensation and dehumidification, which involve transfer of the condensable species from the gas to the liquid phase. air water, yH2O saturated vapor dry air water evaporates eventually water water water 75C, 760 mmHg 75C, 760 mmHg 75C, 760 mmHg If a gas at temperature T and pressure P contains a saturated vapor whose mole fraction is yi (mol vapor/mol total gas), and if this vapor is the only species that would condense if the temperature were slightly lowered, then the partial pressure of the vapor in the gas equals the pure-component vapor pressure pi*(T) at the system temperature, T, P, yH2O Raoult’s Law, Single Condensable Species
Example 6.3-1 Air and liquid water are contained at equilibrium in a closed chamber at 75C and 760 mm Hg. Calculate the molar composition of the gas phase. Solution Since the gas and liquid are in equilibrium, the air must be saturated with water vapor (if it were not, more water would evaporate), so that Raoult’s law may be applied: From Table B.3 in Appendix B, pH2O*(75C)=289 mmHg. Consequently,
Several important points concerning the behavior of gas-liquid systems and several terms used to describe the state of such systems are summarized here. 1.A gas in equilibrium with a liquid must be saturated with the volatile components of that liquid. 2.The partial pressure of a vapor at equilibrium in gas mixture containing a single condensable component cannot exceed the vapor pressure of the pure component at the system temperature. If pi=pi*, the vapor is saturated; any attempt to increase pi – either by adding more vapor to the gas phase or by increasing the total pressure at constant temperature – must instead lead to condensation. 3.A vapor present in gas in less than its saturation amount is referred to as a superheated vapor. For such a vapor, Since only a saturated vapor can condense, to achieve condensation in a system containing a superheated vapor one or more of the variable of above equation must be changed so that the inequality becomes the equality of Raoult’s law. This can be done in several ways, such as by increasing the pressure at constant temperature (the left side increases, while the right side stays constant) or by decreasing the temperature at constant pressure (the left side remains constant, and the right side decreases).
4.If a gas containing a single superheated vapor is cooled at constant pressure, the temperature at which the vapor becomes saturated is referred to as the dew point of the gas. From Raoult’s law, The difference between the temperature and the dew point of a gas is called the degrees of superheat of the gas. If any two of the quantities yi, P, and Tdp (or, equivalently, the temperature of the gas and the degrees of superheat) are known, the third quantity may be determined from above equation and a table, graph, or equation relating pi* and T.
Example 6.3-2 A stream of air at 100C and 5260 mm Hg contains 10.0% water by volume. 1.Calculate the dew point and degrees of superheat of the air. 2.Calculate the percentage of the vapor that condenses and the final composition of the gas phase if the air is cooled to 80C at constant pressure. 3.Calculate the percentage condensation and the final gas-phase composition if, instead of being cooled, the air is compressed isothermally to 8500 mm Hg. 4.Suppose the process of part 2 is run, the product gas is analyzed, and the mole fraction of water differs considerably from the calculated value. What could be responsible for the disparity between calculated and measured values? (List several possibilities.) Solution 1. Table B.3 and the air has 100C-90C=10C of superheat
2. The symbol BDA stands for bone-dry air, a term used to signify the water-free component of an air- water vapor mixture. Basis: 100 mol Feed Gas Raoult’s Law at Outlet Balance on Dry Air 100 mol 0.900 mol BDA mol Total Mole Balance Percentage Condensation
3. Saturation occurs when P is high enough for the inequality to become an equality, or An increase in P above 7600 mm Hg must cause condensation, so that the products from the compression to 8500 mm Hg must include a liquid stream. Basis: 100 mol Feed Gas Raoult’s Law Balance on Dry Air Total Mole Balance Percentage Condensation
4. (a)Experimental error. (b)The condenser was not at steady state when the measurement were made, possibly because the system had not yet leveled out following startup or because water vapor was adsorbing on the walls of the condenser. (c)The emerging and liquid streams were not at equilibrium (e.g., condensation actually occurred at a temperature below 100C and the product streams were separated and reheated before emerging). (d)Raoult’s law does not apply (this is not a likely explanation for the air-water system at the given conditions). The mechanism of evaporation of a liquid depends on the relative values of the vapor pressure of the liquid and the total system pressure. If evaporation takes place at a temperature such that p*<P, the process involves transfer of molecules from the surface of the liquid to the gas above the surface, while if p*=P, vapor bubbles form through the entire liquid, but predominantly at the heated container walls: that is, the liquid boils. The temperature at which p*=P is the boiling point of the liquid at the given pressure. Test Yourself p. 253
In the definitions to be given, the term “saturation” refers to any gas-vapor combination, while “humidity” refers specifically to an air-water system. Suppose a gas at temperature T and pressure P contains a vapor whose partial pressure is pi and whose vapor pressure is pi*(T). Relative Saturation (Relative Humidity) A relative humidity of 40% signifies that the partial pressure of water vapor equals 4/10 of the vapor pressure of water at the system temperature. Molal Saturation (Molal Humidity) Absolute Saturation (Absolute Humidity) Mi is the molecular weight of the vapor Mdry is the average molecular weight of the dry (vapor-free) gas Percentage Saturation (Percentage Humidity) Test Yourself p. 254
Example 6.3-3 Humid air at 75C, 1.1 bar, and 30% relative humidity is fed into a process unit at a rate of 1000 m3/h. Determine (1) the molar flow rates of water, dry air, and oxygen entering the process unit, (2) the molal humidity, absolute humidity, and percentage humidity of the air, and (3) the dew point. Solution 1. 1000 m3 1.1 bar kmolK h 0.0831 m3bar 348 K
2. 3. Table B.3
6.4 Multicomponent Gas-Liquid Systems Gas-liquid process that involves several components in each phase include many chemical reactions, distillation, and transfer of one or more species from a gas to a liquid (absorption or scrubbing) or vice versa (stripping). When multicomponent gas and liquid phase are in equilibrium, a limited number of intensive system variables may be specified arbitrarily (the number is given by the Gibb phase rule), and the remaining variables can then be determined using equilibrium relationships for the distribution of components between the two phases. 6.4a Gas-Liquid Equilibrium Data The best way to evaluate equilibrium compositions is from tabulated data. Perry’s Chemical Engineers’ Handbook, pp. 2-76 through 2-89, gives partial pressures of vapors over various liquid solutions.
Example 6.4-1 A gas stream consisting 100 lb-mole/h of an SO2-air mixture containing 45 mole% SO2 is contacted with liquid water in a continuous absorber at 30C. The liquid leaving the absorber is analyzed and found to contain 2.00 g of SO2 per 100 g of H2O. Assuming that the gas and liquid streams leaving the absorber are in equilibrium at 30C and 1 atm, calculate the fraction of the entering SO2 absorbed in the water and the required water feed rate. Solution Basis: Given Feed Rate of Gas Perry’s Chemical Engineers’ Handbook three unknown process variables
Air Balance SO2 Balance xSO2 (lbm SO2) lb-mole SO2 100 lb-mole 0.45 lb-mole SO2 (h) h 64 lbm SO2 lb-mole (lbm)
H2O Balance yH2O (lb-mole H2O) 18 lbm H2O (h) (lbm) lb-mole H2O Fraction SO2 Absorbed 89,600 lbm liquid effluent 0.0196 lbm SO2 h lbm 100 lb-mole 0.45 lb-mole SO2 64 lbm SO2 h lb-mole lb-mole SO2
6.4b Raoult’s Law and Henry’s Law Relationship governing the distribution of a substance between gas and liquid phases are the subject matter of phase-equilibrium thermodynamics. pA is the partial pressure of A in the gas phase xA is the mole fraction of A in the liquid phase yA is the mole fraction of A in the gas phase pA* is the vapor pressure of pure liquid A at temperature T Raoult’s Law: Raoult’s law is an approximation that is generally valid when xA is close to 1 – that is, when the liquid is almost pure A. It is also sometimes valid over the entire range of compositions for mixtures of similar substances, such as paraffinic hydrocarbons of similar molecular weights. for systems with only one condensable component
Henry’s Law: pA is the partial pressure of A in the gas phase xA is the mole fraction of A in the liquid phase yA is the mole fraction of A in the gas phase HA is the Henry’s law constant for A in a specific solvent at temperature T Henry’s law is generally valid for solutions in which xA is close to 0 (dilute solutions of A) provided that A does not dissociate, ionize, or react in the liquid phase. The law is often applied to solutions of noncondensable gases. Values of Henry’s law constants (or closely related quantities) are given for several gas in water on pp. 2-215 through 2-128 of Perry’s Chemical Engineer’s Handbook, and references to other data sources are given on p. 14-4 of the Handbook. A gas-liquid system in which the vapor-liquid equilibrium relationship for every volatile species is either Raoult’s law or Henry’s law is said to exhibit ideal solution behavior. An ideal solution is a mixture of liquids that exhibits ideal solution behavior at equilibrium. Test Yourself p. 258
Example 6.4-2 Use either Raoult’s law or Henry’s law to solve the following problem. 1.A gas containing 1.00 mole% ethane is in contact with water at 20.0C and 20.0 atm. Estimate the mole fraction of dissolve ethane. 2.An equimolar liquid mixture of benzene (B) and toluene (T) is in equilibrium with its vapor at 30.0C. What is the system pressure and the composition of the vapor? Solution 1. Perry’s Chemical Engineers’ Handbook 2. Table B.4
6.4c Vapor-Liquid Equilibrium Calculations for Ideal Solutions If the liquid is a mixture, the vapor generated generally will have a composition different from that of the liquid. As vaporization proceeds, the composition of the remaining liquid continuously changes, and hence so does its vaporization temperature. When a liquid is heated slowly at constant pressure, the temperature at which the first vapor bubble forms is the bubble-point temperature of the liquid at the given pressure. When a gas (vapor) is cooled slowly at constant pressure, the temperature at which the first liquid droplet forms is the dew-point temperature of the vapor at the given pressure. Calculating bubble-point and dew-point temperatures can be a complex task for an arbitrary mixture of components. However, if the liquid behaves as an ideal solution (one for which Raoult’s or Henry’s law is obeyed for all components) and the gas phase can also be considered ideal, the calculations are relatively straightforward.
bubble-point temperature Raoult’s Law total system pressure, P Tbp is calculated by trial and error. bubble-point pressure dew-point temperature Raoult’s Law G is a noncondensable component. Tdp is calculated by trial and error. dew-point pressure
Example 6.4-3 1.Calculate the temperature and composition of a vapor in equilibrium with a liquid that is 40.0 mole% benzene-60.0 mole% toluene at 1 atm. Is the calculated temperature a bubble- point or dew-point temperature? Solution Let A=benzene and B=toluene This was a bubble-point calculation.
2.Calculate the temperature and composition of a liquid in equilibrium with a gas mixture containing 10.0 mole% benzene, 10.0 mole% toluene, and the balance nitrogen (which may be considered noncondensable) at 1 atm. Is the calculated temperature a bubble-point or dew-point temperature? Solution Let A=benzene and B=toluene trial and error This was a dew-point calculation.
3.A gas mixture consisting of 15.0 mole% benzene, 10.0 mole% toluene, and 75.0 mole% nitrogen is compressed isothermally at 80C until condensation occurs. At what pressure with condensation begin? What will be the composition of the initial condensate? Solution Let A=benzene and B=toluene
6.4d Graphical Representation of Vapor-Liquid Equilibrium The Txy diagram is a plot of the equilibrium temperature versus the mole fraction of one of the components – usually the more volatile one – with curves being drawn for both the liquid phase (T versus xA) and the vapor (T versus yA). A plot this type is shown in Figure 6.4-1a for the benzene – toluene system at P = 1 atm. Alternatively, equilibrium pressure can be plotted against a mole fraction for a fixed temperature to generate a Pxy diagram (Figure 6.4-1b). Figure 6.4-1 Consider the benzene-toluene system and suppose heat is added to a 55 mole% benzene and 45 mole% toluene liquid mixture at a fixed pressure of 1 atm. As Figure 6.4-1a shows, the mixture will begin to boil at 90C, and the vapor generated will contain 77% benzene. However, once a small amount of liquid has been vaporized, the remainder no longer contains 55% benzene; it contains less, since the vapor produced is relatively rich in this component.
Example 6.4-4 1.Using the Txy diagram, estimate the bubble-point temperature and the equilibrium vapor composition associated with a 40 mole% benzene-60 mole% toluene liquid mixture at 1 atm. If the mixture is steadily vaporized until the remaining liquid contains 25% benzene, what is the final temperature? Solution xB=0.25 xB=0.4 100C 95C yB=0.62
2.Using the Txy diagram, estimate the dew-point temperature and the equilibrium liquid composition associated with a vapor mixture of benzene and toluene containing 40% mole% benzene at 1 atm. If condensation proceeds until the remaining vapor contains 60% benzene, what is the final temperature? Solution yB=0.4 102C 96C xB=0.20
Boiling refers to a specific type of vaporization process in which vapor bubbles form at a heated surface and escape from the liquid; it does not refer to molecular evaporation of liquid from a gas-liquid interface, which may occur at temperatures below the boiling point. If a mixture is heated slowly in an open container, vapor bubbles will form at the heated surface and emerge into the gas phase when the vapor pressure of the liquid equals the pressure above the liquid. Some reflection should convince you that the temperature at which this occurs is the bubble point of the liquid at that pressure. For an ideal liquid solution, the boiling point may be determined approximately from the following equation.
Example 6.4-5 A mixture that is 70 mole% benzene and 30 mole% toluene is to be distilled in a batch distillation column. The column startup procedure calls for charging the reboiler at the base of the column and slowly adding heat until boiling begins. Estimate the temperature at which boiling begins and the initial composition of the vapor generated, assuming the system pressure is 760 mm Hg. xB=0.7 Solution The mixture will boil at approximately 87C. The initial vapor composition is approximately 88 mole% benzene and 12 mole% toluene. 87C yB=0.88 Test Yourself p. 264
6.5 Solutions of Solids in Liquids 6.5a Solubility and Saturation The solubility of a solid in a liquid is the maximum amount of that substance that can be dissolved in a specified amount of the liquid at equilibrium. This physical property varies considerably from one solute-solvent pair to another. 100 g of water at 20C can dissolve 222 g of AgNO3, 0.003 g of Ag2CO3, and 0.000002 g of AgBr. The limit may also depend strongly on temperature. The solubility of AgNO3 in 100 g of water increases from 222 g at 20C to 952 g at 100C. If a saturated solution is cooled, the solubility of the solute generally decrease; in order for the cooled solution to return to equilibrium, some solute come out of solution as solid crystals. The crystallization rate may be slow, however, so that a metastable condition can exist in which the concentration of the solute is higher than the equilibrium values at the solution temperature. Under such conditions, the solution is said to be supersaturated and the difference between actual and equilibrium concentrations is referred to as supersaturation. A solution that contains as much of a dissolved species as it can at equilibrium is said to be saturated with that species. A solution in equilibrium with solids solute must be saturated with that solute; if it were not, more solute would dissolve.
Example 6.5-1 One hundred fifty kilograms of a saturated aqueous solution of AgNO3 at 100C is cooled to 20C, thereby forming AgNO3 crystals, which are filtered from the remaining solution. The wet filter cake, which contains 80% solid crystals and 20% saturated solution by mass, passes to a dryer in which the remaining water is vaporized. Calculate the fraction of the AgNO3 in the feed stream eventually recovered as dry crystals and the amount of water that must be removed in the drying stage. Solution
Composition of the Filter Cake H2O Balance Mass Balance Overall AgNO3 Balance Percentage Recovery Overall Mass Balance
6.5b Solid Solubilities and Hydrated Salts The Gibbs phase rule shows that specifying temperature and pressure for a two-component system at equilibrium containing a solid solute and a liquid solution fixes the values of all other intensive variable. Because the properties of liquids and solids are only slightly affected by pressure, a single plot of solubility (an intensive variable) versus temperature may be applicable over a wide pressure range. Figure 6.5-1 The solubility plots shown in Figure 6.5-1 illustrate how the effect of temperature on solubility can vary from system to system. Increasing the temperature from 0C to 100C barely changes NaCl solubility but increases the solubility of KNO3 by more than a factor of 10. For Na2SO4, solubility increases up to about 40C and decreases thereafter.
Example 6.5-2 An aqueous potassium nitrate solution containing 60.0wt% KNO3 at 80C is fed to a cooling crystallizer in which the temperature is reduced to 40C. Determine the temperature at which the solution reaches saturation and the percentage of the potassium nitrate in the feed that forms crystals. Solution Figure 6.5-1 Saturation temperature of this solution is 74C. Basis: 100 kg feed Figure 6.5-1 40 C
H2O Balance 100 kg m1 kg 0.400 kg H2O (1-0.386) kg H2O m1 = 65.1 g = kg kg Mass Balance
The solid crystals that formed in the preceding example consisted of anhydrous (water-free) potassium nitrate. When certain solutes crystallize from aqueous solutions, the crystals are hydrated salts, containing water molecules bonded to solute molecules (water of hydration). The number of water molecules associated with each solute molecule may vary with the crystallization temperature. When sodium sulfate crystallizes from aqueous solution below 40C the crystals that form are anhydrous Na2SO4, while above 40C each molecule of Na2SO4 that crystallized has 10 molecules of water associated with it. The hydrated salt, Na2SO410H2O(s), is called sodium sulfate decahydrate. The change from the anhydrous to the hydrated form of the solid at 40C is responsible for the discontinuity in the plot of Figure 6.5-1. Another solute that forms hydrated salt is magnesium sulfate, which can exist in five different forms in different temperature ranges. (See Table 6.5-1.) Table 6.5-1