Download

1 / 12
140 likes | 298 Vues
MULTIPHASE SYSTEM. Noorulnajwa Diyana Yaacob PPK Bioproses Universiti Malaysia Perlis. Introduction.

E N D
MULTIPHASE SYSTEM NoorulnajwaDiyanaYaacob PPK Bioproses Universiti Malaysia Perlis
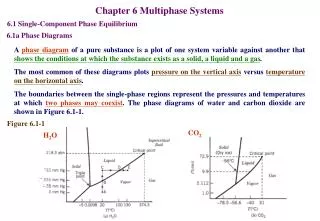
Introduction • In general, bioprocess/biotech/chemical engineers are not dealing with single components; instead they deal with equilibrium of mixtures. When a mixture begins to boil, the vapor does not, in general, have the same composition as the liquid. Instead, the substance with the lower boiling temperature (or higher vapor pressure) will have a vapor concentration higher than that with the higher boiling temperature, though both will be present in the vapor. A similar argument applies when a vapor mixture condenses. • The concentrations of the vapor and liquid when the overall concentration and one of the temperature or pressure are fixed can easily be read off of a phase diagram. In order to read and understand a phase diagram, it is necessary to understand the concepts of bubble point and dew point for a mixture.
Bubble Point & Dew Point • In order to be able to predict the phase behavior of a mixture, scientists and engineers examine the limits of phase changes, and then utilize the laws of thermodynamics to determine what happens in between those limits. The limits in the case of gas-liquid phase changes are called the bubble point and the dew point.
The names imply which one is which: • The bubble point is the point at which the first drop of a liquid mixture begins to vaporize. • The dew point is the point at which the first drop of a gaseous mixture begins to condense.
If you are able to plot both the bubble and the dew points on the same graph, you come up with what is called a Pxy or a Txy diagram, depending on whether it is graphed at constant temperature or constant pressure. The "xy" implies that the curve is able to provide information on both liquid and vapor compositions, as we will see when we examine the thermodynamics in more detail.
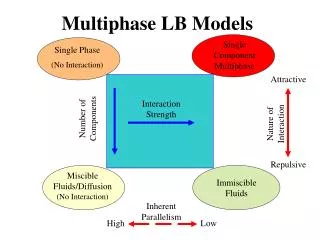
Txy and Pxy diagrams In order to avoid getting confused about what you're looking at, think: what causes a liquid to vaporize? Two things should come to mind: Increasing the temperature Decreasing the pressure Therefore, the region with the higher pressure is the liquid region, and that of lower pressure is vapor, as labeled. The region in between the curves is called the two-phase region.
We can determine, given the mole fraction of one component and a pressure, whether the system is gas, liquid, or two-phase, which is critical information from a design standpoint. • For example, if the Benzene composition in the Benzene-Toluene system is 40% and the pressure is 25 mmHg, the entire mixture will be vapor, whereas if the pressure is raised to 50 mmHg it will all condense. The design of a flash evaporator at 20oC would require a pressure between about 30 and 40 mmHg (the 2-phase region). • We can also determine the composition of each component in a 2-phase mixture, if we know the overall composition and the vapor pressure. First, start on the x-axis at the overall composition and go up to the pressure you want to know about. Then from this point, go left until you reach the bubble-point curve to find the liquid composition, and go to the right until you reach the dew-point curve to find the vapor composition
Gas-Liquid Equilibria • Raoult’s Law • approximation generally valid when xA∼1 (i.e., liquid nearly pure A) or when the components are similar in structure. • Henry’s Law • approximation generally valid when xA∼0 (dilute solution of A) provided A does not dissociate, ionize, or react in the liquid phase. • In an ideal solution, the gas-liquid behavior of every volatile component can be described by Raoult’s or Henry’s Law.
VLE of Ideal Solutions • When a liquid is heated slowly at constant pressure, the temperature at which the first vapor bubble forms is called the bubble-point temperature. • When a vapor is colled slowly at constant pressure, the temperature at which the first liquid droplet forms is the dew-point temperature. • For mixtures that behave as ideal solutions (Raoult’s and Henry’s laws apply), and the gas phase can be considered ideal, calculation of these temperatures is relatively simple.
Phase Diagram Freezing is the phase change as a substance changes from a liquid to a solid. Melting is the phase change as a substance changes from a solid to a liquid. Condensation is the phase change as a substance changes from a gas to a liquid. Vaporization is the phase change as a substance changes from a liquid to a gas. Sublimation is the phase change as a substance changes from a solid to a gas without passing through the intermediate state of a liquid. Deposition is the phase change as a substance changes from a gas to a solid without passing through the intermediate state of a liquid. TRIPLE POINT - The temperature and pressure at which the solid, liquid, and gas phases exist simultaneously. CRITICAL POINT - The temperature above which a substance will always be a gas regardless of the pressure.