Download
1 / 18
180 likes | 326 Vues
Data Journalism @MSCNE. 2014. Dr. Barry Hollander Grady College barryhollander.com. Data Journalism @MSCNE. Who the hell am I and why am I talking about this?. 2014. These slides are online at http://www.barryhollander.com/MSCNE14.pptx. 1. Been a working journalist.

E N D
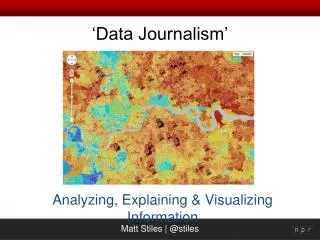
Data Journalism@MSCNE 2014 Dr. Barry HollanderGrady Collegebarryhollander.com
Data Journalism@MSCNE Who the hell am I and why am I talking about this? 2014 These slides are online at http://www.barryhollander.com/MSCNE14.pptx 1. Been a working journalist. 2. Used the Internet a while. 3. Learned to crunch data in grad school. 4. Teach it now to unsuspecting j-students. 5. Cecil ran out of people to ask. That left me. Plus I get a snazzy t-shirt
The word “data” scares people. It means coding. It means math. And as we all know …
The word “data” scares people. It means coding. It means math. And as we all know … https://www.youtube.com/watch?v=_xjgI5oN8DM
Data Journalism@MSCNE We’re going to talk aboutpainless data journalism 2014 or, mostly painless These slides are online at http://www.barryhollander.com/MSCNE14.pptx 1. Stuff you can do. Now. 2. Stuff that makes good stories. 3. Stuff that requires simple skills. 4. Stuff that creates evergreen material. 5. And stuff that uses better words than “stuff.”
A Quick Historyreal quick, this ain’t history class Data used in 1800s, from The Guardian to Florence Nightingale's report on health and mortality In 1952, CBS News and the UNIVAC In 1967, Phil Meyer on Detroit riots, later with Miami and Philadelphia papers on property values and criminal sentencing. Personal computers, more tools emerged. Support groups, like IRE and NICAR. If there is a growth industry in journalism, it’s data journalism (along with – sigh – Buzzfeed).
Why do data matter? Take us beyond the Who, What, When, Where, and into Why and How Verify and solidify traditional reporting methods Can show what’s happened and even, if done right, a glimpse into the future Gives sense and structure to lots of information for your audience Increases the credibility of your work, very important Can open new approaches and ways to tell a story Allows you to provide independent interpretation of official information and data And let’s you play with fun toys
FiveComponents 1. The story or issue or event or incident 2. Curiosity 3. The data (format, structure, origin) 4. Solid reporting and interviewing (not just of people, but the data itself) 5. A data-driven mindset, seeking patterns and comparisons, a social science mentality Nerd Moment: Think in terms of Variables, which have Attributes and Values. Variable: Crime Attribute: Arson, murder, etc.Value: How many of each, or per capita, etc.
Data areEverywhere But remember, stories are about people. Never ever forget that. Really. I mean it. People first, dammit 1. Finding data, negotiating access 2. Cleaning the data 3. Interviewing the data, skeptical analysis 4. Data Viz 5. And don’t forget … real people
Ninety percent of data journalism is done with that old friend, the spreadsheet. Simply put, a spreadsheet is the basic tool of all data-driven journalism, at least on the analysis side. When we talk about the visual display of data or graphics, that’s a different story. Not one I’ll tell today. Especially Excel But more often now, Google spreadsheets
Examples of GoodData SourcesImages below clickable http://nces.ed.gov/ipeds/datacenter/ http://www.ope.ed.gov/security/ You probably have an office of institutional research on your campus. I promise, someone is in charge of data. Make them your friend. So. Much. Data. Bonus Finally, steal shamelessly from others, such as the NYTimesStudent Loan Calculator.
Examples fromdata I’ve used Here’s the part where I show you data I’ve collected and played with, just to show you examples of how easy it is to do. Steal these ideas. Use them.
Dumb (and not so dumb) Ideas ForData Stories Use Yelp for nearly anything, such as a comparison of college towns and coffee shops. Not unlike what 538 is doing for burritos, which everyone from Slate to LATimes covered. The lesson here? Be creative. Ye olde grocery story. Create a typical “college student grocery basket” (fun exercise in and of itself) and price it out at local groceries. Multiply by # of weeks in a semester or year. Assign someone to stand at a key intersection and count the people driving while staring at their phones. Also, the number of pedestrians doing the same. Students have those annoying but lovable guide dogs in training on campus? Human Subjects (Institutional Review Board) on campus. Fun data, because everyone loves to experiment on college sophomores. Another fun one: check out the Wikipedia page for your school or key people. How often edited? By whom? What changes? Controversial stuff? Here’s UGA’s history. Basically, (1) for any story, ask if there may be data, or (2) find odd and interesting data, build a story around it.
Data Journalism@MSCNE 2014 These slides are online at http://www.barryhollander.com/MSCNE14.pptx
Extra stuff later, probably not used, but I hate deleting slides
StoryExamples NYTimesstudent loan calculator. Check out schools, compare. Private college leaders do well College sports thrive during economic downturn Searching IRE under “dormitories” Always steal shamelessly by searching IRE’s site. UC loses millions on interest-rate bets
IRE’s Extra-extra. Worth your time. http://ire.org/blog/extra-extra/ But also search for “education” or even “university” Steal shamelessly. http://ire.org/blog/extra-extra/education/ http://ire.org/search/?q=university http://www.nytimes.com/interactive/2014/your-money/student-loan-repayment-calculator.html http://nces.ed.gov/ipeds/datacenter/ Does your cop shop put stuff online, like UGA? Put link here for them http://www.police.uga.edu/ And use crime maps like this https://www.crimereports.com/map?search=ATHENS%2C+GA Common data set http://www.commondataset.org/ But, gotta go to your individual school or skuls, much of it available via IPEDS.
Example stories http://ire.org/blog/extra-extra/2014/01/20/free-game-tickets-hot-concert-seats-politics-highe/ http://ire.org/blog/extra-extra/2014/03/05/university-california-losing-millions-dollars-inte/ http://ire.org/blog/extra-extra/2014/01/27/missouri-public-universities-spend-millions-lobbyi/ http://ire.org/blog/extra-extra/2014/04/16/new-york-times-investigates-bungled-sexual-assault/ http://ire.org/search/?q=dormitories http://ire.org/blog/extra-extra/2013/11/20/gilded-goodbye-many-private-college-leaders/ http://ire.org/blog/extra-extra/2014/05/02/college-sports-revenue-goes-despite-recession/