Download

1 / 13
170 likes | 385 Vues
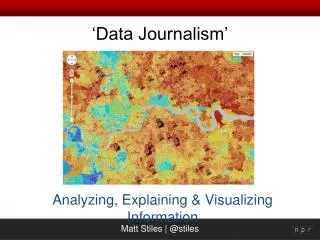
Data Driven Journalism. Data Driven Journalism?. Web is a vast sea of data Often too complicated for public Journalist’s role Examine it Look for newsworthy info Refine it Make it clear Find the story!. A few concepts. Most data is not “searchable” Kept in “silos”

E N D
Data Driven Journalism? • Web is a vast sea of data • Often too complicated for public • Journalist’s role • Examine it • Look for newsworthy info • Refine it • Make it clear • Find the story!
A few concepts • Most data is not “searchable” • Kept in “silos” • Many predate World Wide Web • 90 percent of info can’t be googled
Data Examples • City salaries • Restaurant inspections • Property values • Crime maps • Police Logs(Cal Poly PD) • Sex offenders
Reporting Examples • SanLuisObispo.Com Crime Maps • LA Times – Teacher Performance • Sac Bee – Wildfire History • NY Times – Census Map
People Search • Zabasearch.com (free) • Spokeo • Intelius.com (paid)
Using Spreadsheets • Microsoft Excel, iWork, OpenOffice • Example: Farm Subsidies • Copy data into Excel • Google Docs Spreadsheets
Demo: Build a ChartTop 10 highest salaries in SLO • Get the data • Copy into Excel • Upload to Google Docs
LAB: Build a Chart • Find the top 10 highest salaries in your hometown at: lgcr.sco.ca.gov • Use “Total Wages” column • Click column name to sort list • Put the data into Excel • Column A should be “Title” • Column B should be “Salary” • Create a chart using Google Docs • Show me your finished chart
LAB 2 • We will pick a public figure and work in teams of two to see who can gather the most complete dossier of information from online sources within 25 minutes.