Download
1 / 55
550 likes | 614 Vues
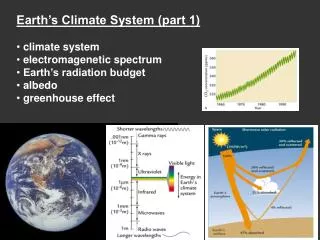
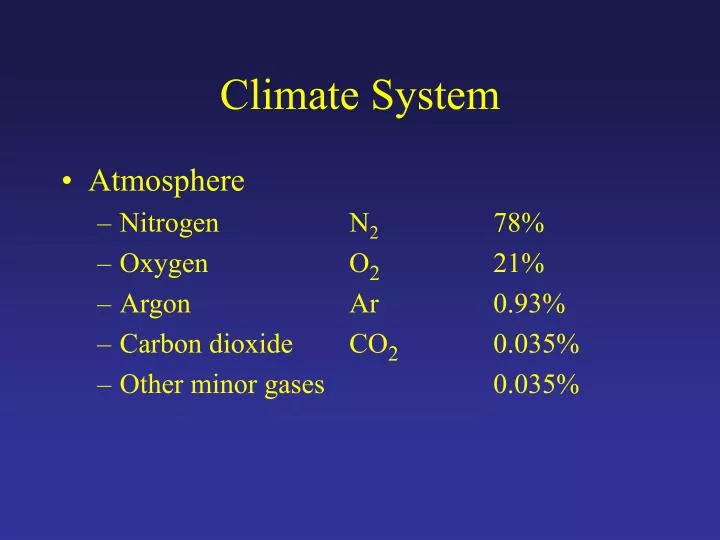
Climate System. Atmosphere Nitrogen N 2 78% Oxygen O 2 21% Argon Ar 0.93% Carbon dioxide CO 2 0.035% Other minor gases 0.035%. Greenhouse Gases. CO 2 , H 2 0 and methane (CH 4 ): Absorb and re-radiate radiation Insulates and raises Earth temperature.

E N D
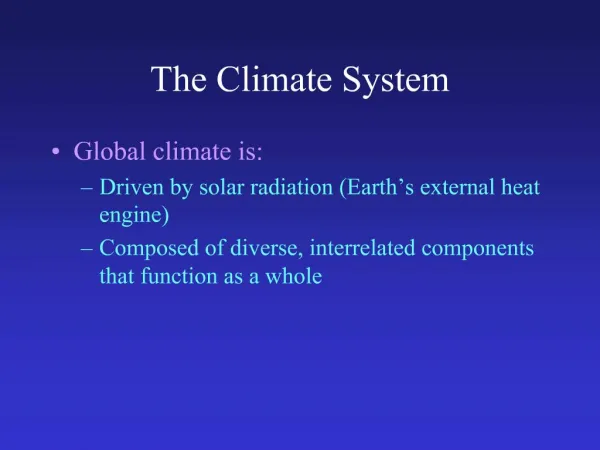
Climate System • Atmosphere • Nitrogen N2 78% • Oxygen O2 21% • Argon Ar 0.93% • Carbon dioxide CO2 0.035% • Other minor gases 0.035%
Greenhouse Gases • CO2, H20 and methane (CH4): • Absorb and re-radiate radiation • Insulates and raises Earth temperature
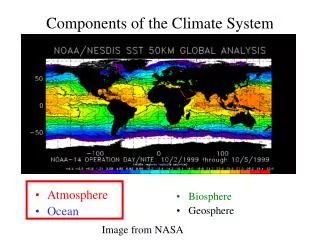
The influence of Carbon on climate change ATMOSPHERE Land-use change: deforestation, agriculture (1.7 Gt/yr) Land uptake By new plant growth (1.9 Gt/yr) Ocean uptake by air-sea gas exchange (1.9 Gt/yr) Fossil- fuel burning (5.3 Gt/yr) OCEAN Terrestrial biosphere LAND Cement production (0.1 Gt/yr) Fossil organic carbon Rock carbonates GEOLOGIC RESERVOIRS
Human activities release a total of 7.1 Gt of carbon into the atmosphere each year. New plant growth and air-sea gas exchange remove 3.8 Gt/yr,… …yielding a net atmospheric increase of 3.3 Gt/yr. ATMOSPHERE Land-use change: deforestation, agriculture (1.7 Gt/yr) Land uptake By new plant growth (1.9 Gt/yr) Ocean uptake by air-sea gas exchange (1.9 Gt/yr) Fossil- fuel burning (5.3 Gt/yr) OCEAN Terrestrial biosphere LAND Cement production (0.1 Gt/yr) Fossil organic carbon Rock carbonates GEOLOGIC RESERVOIRS
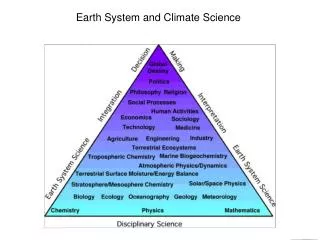
Climate Change Understanding Natural Climate Variability: Use the geologic record to understand Earth Climate in the past (Uniformitarianism)
Milankovitch cycles Related to variations in: 1. Eccentricity 2. Tilt of axis 3. Precession (wobble)
Long-term change can be assessed from ice cores, which record annual cycles of ice formation from snow.
Climate has been relatively warm and stable during the last 10,000 years. Ice Ages Deglaciation High Relative carbon dioxide and methane concentrations Temperature relative to present climate (°C) Key: Temperature CO2 Low Methane Thousands of years before present
The 20th-century is clearly anomalous when compared with the last millennium. Northern Hemisphere temperature anomaly (°C) CO2 concentration (ppm) Temperature CO2 concentration Years
A recent warming trend correlates with the increase in CO2. Global temperature anomaly (°C) CO2 concentration (ppm) Temperature CO2 concentration Years
Atmospheric CO2 Projections Under 3 Alternate Scenarios…. 2020 2040 2060 2080 2000 2100 Year
….and Estimated Average Surface Temperatures for Those Scenarios Uncertainty envelope due to lack of knowledge of climate system
Feedback enhances warming • Positive Feedback: • Amplifies changes in the system. • Temperature increase decreases Earth’s albedo by reducing snow and ice cover
Evidence for Warming • Weather is highly variable* • Glaciers provide long-term trends
Weather Related Hazards 1. Drought 2. Desertification 3. Heat waves 4. Snow and Ice 5. Global Warming 6. El Niño
Transition zones between deserts and humid areas are fragile
Soil gets eroded by wind and water Productive land becomes degraded Main culprits: Overgrazing Overplowing
Human activity can stress the ecosystem • Grazing • Cutting trees for charcoal • Some agriculture
El Niño • Pacific Ocean is pushed westward by trade winds • Warm water off Peru is replaced by upwelling of cold, deep, nutrient-rich water • Circulation reverses: El Niño • 6 Year cycle • Opposite extreme in weather patterns is La Nina
El Niño Subtropical trade winds weaken Warm surface water remains in east Pacific Incessant rain to west coasts Fisheries suffer (no cold, nutrient-rich upwelling water)
Outline • Drainage Basins • Discharge • Sediment load • Meandering/Braided rivers • Floodplains • Flooding
SEA SEA LAND LAND + 336 Runoff from land + 398 Precipitation over sea + 434 Evaporation + 434 Evaporation – 398 Precipitation + 436 Excess to land via precipitation + 107 Precipitation – 371 Evaporation + 436 Runoff to ocean + 107 Precipitation – 336 Runoff to ocean + 471 Evaporation Flux in and flux out over oceans is almost balanced. Precipitation 107 The precipitation runs off into lakes, streams, and oceans… Evaporation 71 Excess is moved to land and precipitates. Evaporation 434 Precipitation 398 Surface runoff Infiltration Runoff 36 Groundwater table Groundwater flow …or filters into soil and rock, where it moves as groundwater.
Drainage Basins/Watersheds • Rio Grande River basin includes: • Chama • Puerco • Pecos (and all of its tributaries) • It doesn’t include the Gila, because it flows into Colorado • Continental Divide (in NM) separates: • Rio Grande drainage • Colorado River drainage
San Juan Rio Grande Colorado Gila Pecos Rio Grande
Discharge/Total Flow • Q=VA • Q is discharge • V is average velocity (m/s) • A is cross-sectional area (m2) • units of Q?