Download
1 / 1
10 likes | 111 Vues
Light curves of UM673 A&B in 2003-2008. Since quasar components change their brightnesses in a similar way, the observed variations are most probably connected with the intrinsic quasar variability and can be used to measure the time delay between images of UM673.

E N D
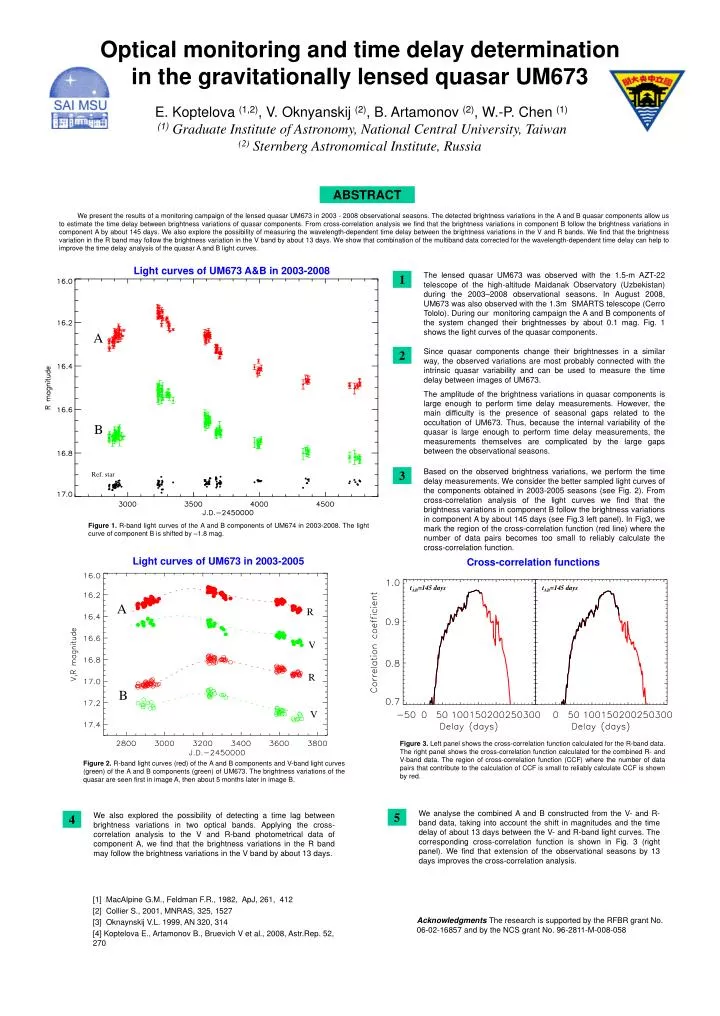
Light curves of UM673 A&B in 2003-2008 Since quasar components change their brightnesses in a similar way, the observed variations are most probably connected with the intrinsic quasar variability and can be used to measure the time delay between images of UM673. The amplitude of the brightness variations in quasar components is large enough to perform time delay measurements. However, the main difficulty is the presence of seasonal gaps related to the occultation of UM673. Thus, because the internal variability of the quasar is large enough to perform time delay measurements, the measurements themselves are complicated by the large gaps between the observational seasons. We also explored the possibility of detecting a time lag between brightness variations in two optical bands. Applying the cross-correlation analysis to the V and R-band photometrical data of component A, we find that the brightness variations in the R band may follow the brightness variations in the V band by about 13 days. The lensed quasar UM673 was observed with the 1.5-m AZT-22 telescope of the high-altitude Maidanak Observatory (Uzbekistan) during the 2003–2008 observational seasons. In August 2008, UM673 was also observed with the 1.3m SMARTS telescope (Cerro Tololo). During our monitoring campaign the A and B components of the system changed their brightnesses by about 0.1 mag. Fig. 1 shows the light curves of the quasar components. We analyse the combined A and B constructed from the V- and R-band data, taking into account the shift in magnitudes and the time delay of about 13 days between the V- and R-band light curves. The corresponding cross-correlation function is shown in Fig. 3 (right panel). We find that extension of the observational seasons by 13 days improves the cross-correlation analysis. Based on the observed brightness variations, we perform the time delay measurements. We consider the better sampled light curves of the components obtained in 2003-2005 seasons (see Fig. 2). From cross-correlation analysis of the light curves we find that the brightness variations in component B follow the brightness variations in component A by about 145 days (see Fig.3 left panel). In Fig3, we mark the region of the cross-correlation function (red line) where the number of data pairs becomes too small to reliably calculate the cross-correlation function. 1 2 4 3 5 A B Ref. star Figure 1. R-band light curves of the A and B components of UM674 in 2003-2008. The light curve of component B is shifted by –1.8 mag. Figure 3. Left panel shows the cross-correlation function calculated for the R-band data. The right panel shows the cross-correlation function calculated for the combined R- and V-band data. The region of cross-correlation function (CCF) where the number of data pairs that contribute to the calculation of CCF is small to reliably calculate CCF is shown by red. Figure 2. R-band light curves (red) of the A and B components and V-band light curves (green) of the A and B components (green) of UM673. The brightness variations of the quasar are seen first in image A, then about 5 months later in image B. [1] MacAlpine G.M., Feldman F.R., 1982, ApJ, 261, 412 [2] Collier S., 2001, MNRAS, 325, 1527 [3] Oknaynskij V.L. 1999, AN 320, 314 [4] Koptelova E., Artamonov B., Bruevich V et al., 2008, Astr.Rep. 52, 270 AcknowledgmentsThe research is supported by the RFBR grant No. 06-02-16857 and by the NCS grant No. 96-2811-M-008-058 Optical monitoring and time delay determination in the gravitationally lensed quasar UM673E. Koptelova (1,2), V. Oknyanskij (2), B. Artamonov (2), W.-P. Chen (1)(1)Graduate Institute of Astronomy, National Central University, Taiwan(2) Sternberg Astronomical Institute, Russia ABSTRACT Abstract We present the results of a monitoring campaign of the lensed quasar UM673 in 2003 - 2008 observational seasons. The detected brightness variations in the A and B quasar components allow us to estimate the time delay between brightness variations of quasar components. From cross-correlation analysis we find that the brightness variations in component B follow the brightness variations in component A by about 145 days. We also explore the possibility of measuring the wavelength-dependent time delay between the brightness variations in the V and R bands. We find that the brightness variation in the R band may follow the brightness variation in the V band by about 13 days. We show that combination of the multiband data corrected for the wavelength-dependent time delay can help to improve the time delay analysis of the quasar A and B light curves. Light curves of UM673 in 2003-2005 Cross-correlation functions tAB=145 days tAB=145 days A R V R B V