Download
1 / 1
10 likes | 164 Vues
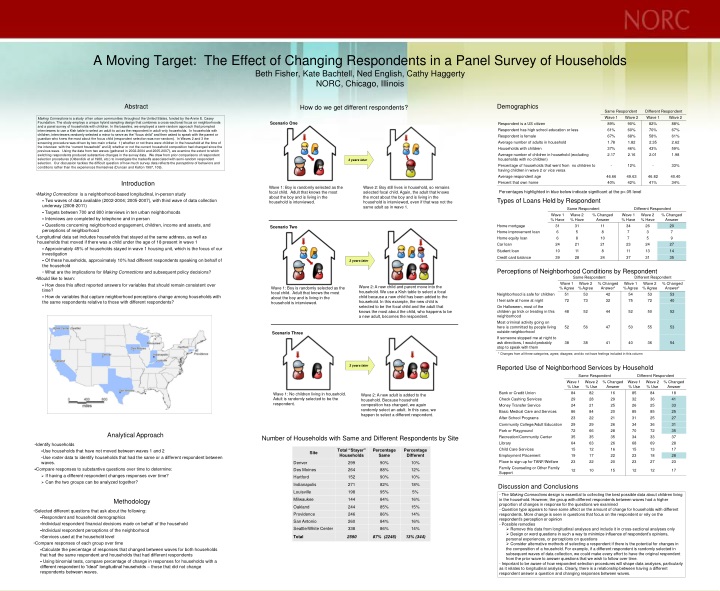
A Moving Target: The Effect of Changing Respondents in a Panel Survey of Households Beth Fisher, Kate Bachtell, Ned English, Cathy Haggerty NORC, Chicago, Illinois. Abstract. Demographics. How do we get different respondents?.

E N D
A Moving Target: The Effect of Changing Respondents in a Panel Survey of HouseholdsBeth Fisher, Kate Bachtell, Ned English, Cathy Haggerty NORC, Chicago, Illinois Abstract Demographics How do we get different respondents? Making Connections is a study of ten urban communities throughout the United States, funded by the Annie E. Casey Foundation. The study employs a unique hybrid sampling design that combines a cross-sectional focus on neighborhoods and a panel survey of households with children. In the baseline, we employed a semi-random approach that prompted interviewers to use a Kish table to select an adult to act as the respondent in adult-only households. In households with children, interviewers randomly selected a minor to serve as the “focus child” and then asked to speak with the parent or guardian who knew the most about the focus child (respondent selection was non-random). In Waves 2 and 3 the screening procedure was driven by two main criteria: 1) whether or not there were children in the household at the time of the interview with the “current household” and 2) whether or not the current household composition had changed since the previous wave. Using the data from two waves (gathered in 2002-2004 and 2005-2007), we examine the extent to which switching respondents produced substantive changes in the survey data. We draw from prior comparisons of respondent selection procedures (Oldendick et al 1988, etc.) to investigate the tradeoffs associated with semi-random respondent selection. Our discussion tackles the difficult question of how much survey data reflects the perceptions of behaviors and conditions rather than the experiences themselves (Duncan and Kalton 1987, 109). Scenario One 3 years later Introduction Wave 1: Boy is randomly selected as the focal child. Adult that knows the most about the boy and is living in the household is interviewed. Wave 2: Boy still lives in household, so remains selected focal child. Again, the adult that knows the most about the boy and is living in the household is interviewed, even if that was not the same adult as in wave 1. Percentages highlighted in blue below indicate significant at the p=.05 level • Making Connections is a neighborhood-based longitudinal, in-person study • Two waves of data available (2002-2004; 2005-2007), with third wave of data collection underway (2008-2011) • Targets between 700 and 800 interviews in ten urban neighborhoods • Interviews are completed by telephone and in person • Questions concerning neighborhood engagement, children, income and assets, and perceptions of neighborhood • Longitudinal data set includes households that stayed at the same address, as well as households that moved if there was a child under the age of 18 present in wave 1 • Approximately 45% of households stayed in wave 1 housing unit, which is the focus of our investigation • Of these households, approximately 10% had different respondents speaking on behalf of the household • What are the implications for Making Connections and subsequent policy decisions? • Would like to learn: • How does this affect reported answers for variables that should remain consistent over time? • How do variables that capture neighborhood perceptions change among households with the same respondents relative to those with different respondents? Types of Loans Held by Respondent Scenario Two 3 years later Perceptions of Neighborhood Conditions by Respondent Wave 2: A new child and parent move into the household. We use a Kish table to select a focal child because a new child has been added to the household. In this example, the new child is selected to be the focal child and the adult that knows the most about the child, who happens to be a new adult, becomes the respondent. Wave 1: Boy is randomly selected as the focal child. Adult that knows the most about the boy and is living in the household is interviewed. Scenario Three * Changes from all three categories, agree, disagree, and do not have feelings included in this column 3 years later Reported Use of Neighborhood Services by Household Wave 1: No children living in household. Adult is randomly selected to be the respondent. Wave 2: A new adult is added to the household. Because household composition has changed, we again randomly select an adult. In this case, we happen to select a different respondent. Analytical Approach Number of Households with Same and Different Respondents by Site • Identify households • Use households that have not moved between waves 1 and 2 • Use roster data to identify households that had the same or a different respondent between waves. • Compare responses to substantive questions over time to determine: • If having a different respondent changes responses over time? • Can the two groups can be analyzed together? Discussion and Conclusions • The Making Connections design is essential to collecting the best possible data about children living in the household. However, the group with different respondents between waves had a higher proportion of changes in response for the questions we examined • Question type appears to have some affect on the amount of change for households with different respondents. More change is seen in questions that focus on the respondent or rely on the respondent’s perception or opinion • Possible remedies • Remove this data from longitudinal analyses and include it in cross-sectional analyses only • Design or word questions in such a way to minimize influence of respondent’s opinions, personal experiences, or perceptions on questions • Consider alternative methods of selecting a respondent if there is the potential for changes in the composition of a household. For example, if a different respondent is randomly selected in subsequent waves of data collection, we could make every effort to have the original respondent from the prior wave to answer questions that we wish to follow over time. • Important to be aware of how respondent selection procedures will shape data analyses, particularly as it relates to longitudinal analysis. Clearly, there is a relationship between having a different respondent answer a question and changing responses between waves. Methodology • Selected different questions that ask about the following: • Respondent and household demographics • Individual respondent financial decisions made on behalf of the household • Individual respondent perceptions of the neighborhood • Services used at the household level • Compare responses of each group over time • Calculate the percentage of responses that changed between waves for both households that had the same respondent and households that had different respondents • Using binomial tests, compare percentage of change in responses for households with a different respondent to “ideal” longitudinal households – those that did not change respondents between waves.