Download
1 / 22
260 likes | 1.25k Vues
GrADS 画图入门. Grid Analysis and Display System. 高拴柱 gaosz@cma.gov.cn 国家气象中心 2008 年 12 月 7 日. Outline. 1 、 grads 功能概述 ( 不讲 ) 2 、 Grads 数据准备: ( 1 ) ncep 资料的直接读取 ( 2 ) mm5out_to_Grads,wrfoutput_to_grads ( 3 ) 二进制格点数据 dat 的生成和 数据描述文件 ctl 作用 ( 4 ) 站点数据 的准备以及站点图形的绘制 3 、图形显示类型及绘图设置:

E N D
GrADS 画图入门 Grid Analysis and Display System 高拴柱 gaosz@cma.gov.cn 国家气象中心 2008年12月7日
Outline • 1、grads功能概述(不讲) • 2、Grads数据准备: (1)ncep资料的直接读取 (2)mm5out_to_Grads,wrfoutput_to_grads (3)二进制格点数据dat的生成和数据描述文件ctl作用 (4)站点数据的准备以及站点图形的绘制 • 3、图形显示类型及绘图设置: (1)一维:直方、折线、散点、误差图.... (2)二维:等值线、阴影图、风矢量、流线图、站点天气图 (3)图形设置:坐标、线型、页面、地图投影、地表状况、图形信息开关 • 4、grads函数的使用: (1)数学函数 (2)统计函数 (3)网格处理函数 • 5、grads批处理脚本: • 6、练习:
open (9,file=’example.ctl’) write(9, ’(a)’) ‘dset ^example.dat’ write(9, ’(a)’) ‘title 5 days of model output’ write(9, ’(a)’) ‘undef -2.56e33' write(9, ’(a)’) ‘xdef 72 linear 100.0 1.0' write(9, ’(a)’) ‘ydef 46 linear 10.0 1.0' write(9, ’(a)’) ‘zdef 7 levels 1000,850,700,500,300,200,100' write(9, ’(a)’) ‘tdef 5 linear 02jan2008 1dy’ write(9, ’(a)’) ‘vars 5' write(9, ’(a)’) ‘ps 0 99 Surface Pressure’ write(9, ’(a)’) ‘z 7 99 Geopotential Heights’ write(9, ’(a)’) ‘u 7 99 U winds’ write(9, ’(a)’) ‘v 7 99 V winds’ write(9, ’(a)’) ‘q 5 99 Specific Humidity’ write(9, ’(a)’) ‘endvars' close(9) real ps(72,46,5), z(72,46,7,5),u(72,46,7,5),v(72,46,7,5),q(72,46,5,5) .......read(***)ps,z,u,v,q...... open (8,file=’example.dat’,form=’unformatted’,access=’direct’,recl=72*46*4) irec = 0 do it=1,5 irec=irec+1 write(8,rec=irec) ((ps(j,i,it),j=1,72),i=1,46) do k=1,7 irec=irec+1 write(8,rec=irec+1) ((z(j,i,k,it),j=1,72),i=1,46) enddo ………….u,v,q……………………………………. enddo • 2、Grads数据准备: (1)ncep资料的直接读取 (2)mm5_to_Grads,wrf_to_grads (3)二进制格点数据dat的生成和数据描述文件ctl作用
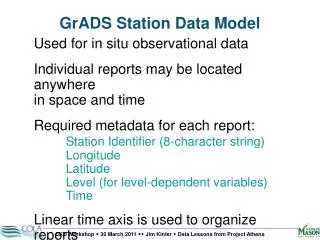
data zlev/1000,925,850,700,500,400,300,250,200,150,100/ tim=0.0;ilev=11;nflag=0 open(2,file=filename.dat,form='unformatted',access='direct',recl=73*4) irecord=0 do j=1,irec irecord=irecord+1 write(2,rec=irecord)'abc'//sta(j)(1:5),lat(j),lon(j),tim,ilev,nflag, + (zlev(i),z(j,i),t(j,i),td(j,i),d(j,i),f(j,i),i=1,11) enddo ilev=0 irecord=irecord+1 write(2,rec=irecord)'abcdefgh',lat(1),lon(1),tim,ilev,nflag, + (zlev(i),i=1,11),(z(1,i),i=1,11),(t(1,i),i=1,11), + (td(1,i),i=1,11),(d(1,i),i=1,11),(f(1,i),i=1,11) close(2) open(3,file=filename.ctl,form='formatted',status='unknown') write(3,'(a)')'dset ^'//filename.dat write(3,'(a)')'dtype station' write(3,'(a)')'stnmap ^sounding.map' write(3,'(a)')'undef -999.0' write(3,'(a)')'title sounding' write(3,'(a)')'tdef 1 linear 02JAN1987 1DY ' write(3,'(a)')'vars 5' write(3,'(a)')'zz 11 99 '//staa//' height1' write(3,'(a)')'tt 11 99 '//staa//' temper1' write(3,'(a)')'t_td 11 99 '//staa//' t_td1' write(3,'(a)')'uu 11 99 '//staa//' u wind1' write(3,'(a)')'vv 11 99 '//staa//' v wind1' write(3,'(a)')'endvars‘ close(3) • 2、Grads数据准备: (1)ncep资料的直接读取 (2)mm5_to_Grads,wrf_to_grads (3)二进制格点数据dat的生成和数据描述文件ctl作用 (4)站点数据的准备以及站点图形的绘制
ga-> close 1 Close Error: Only last file may be closed ga-> close 2 File 2 has been closed ga> 打开ctl文件 命令:open filename1.ctl ga-> open strike024_041714 Scanning description file: strike024_041714 Data file strike024_041714.dat is open as file 1 LON set to 100 150 LAT set to 0 40 LEV set to 1000 1000 Time values set: 2005:4:17:0 2005:4:17:0 命令:open filename2.ctl ga-> open strike024_041720 Scanning description file: strike024_041720 Data file strike024_041720.dat is open as file 2
查询命令 命令:query files ga-> q files File 1 : TC0801-StrkPro024 2008041714 Descriptor: strike024_041714.ctl Binary: strike024_041714.dat File 2 : TC0801-StrkPro024 2008041720 Descriptor: strike024_041720.ctl Binary: strike024_041720.dat 命令:query file n ga-> q file 2 File 2 : TC0801-StrkPro024 2008041720 Descriptor: strike024_041720.ctl Binary: strike024_041720.dat Type = Gridded Xsize = 101 Ysize = 81 Zsize = 2 Tsize = 1 Number of Variables = 2 strp 0 0 strike probability strn 0 0 strike number
查询命令 命令:query ctlinfo ga-> q ctlinfo dset strike024_041714.dat title TC0801-StrkPro024 2008041714 undef 9999 xdef 101 linear 100 0.5 ydef 81 linear 0 0.5 zdef 2 levels 1000 500 tdef 1 linear 00Z19JUL2005 60mn vars 2 strp 0 0 strike probability strn 0 0 strike number 命令:query dims ga-> q dims Default file number is: 1 X is varying Lon = 100 to 150 X = 1 to 101 Y is varying Lat = 0 to 40 Y = 1 to 81 Z is fixed Lev = 1000 Z = 1 T is fixed Time = 00Z19JUL2005 T = 1
3、图形显示类型及绘图设置: (1)一维:直方、折现、散点、误差图....(excel 2003) (2)二维:标量场——等值线、阴影图 矢量场——风矢量、流线图 站点—— (3) draw line/string/title/mark……
标量场分析 1. 等值线 设置 set gxout contour(缺省) 2. 阴影图 设置 set gxout shaded • 等值线 • 命令:display express • ga-> d strp • Contouring: 0 to 100 interval 10 设置:set *** ###
维数参数设置 等值线设置 set cint 15 指定等值线间隔 set ccolor 3 指定等值线颜色 0:黑; 1:白;2:红;3:绿;4:蓝;5:;6:;7:黄;8:桔黄; 9:紫;10:黄绿;11:中蓝;12:深蓝;13:;14:深紫;15:灰色 set cstyle 2 指定等值线线形 1:实线;2:长断线;3:短断线;4:一长一短断线; 5:点线;6:点划线;7:点点划线 set cthick 10 设定线粗细(1-10) set cmin 10 不画低于10(含)以下的等值线 set cmax 90 不画超过90(不含)以上的等值线 set clevs 495 523 534 556 560 564 572 584 588 set ccols 1 2 3 4 5 当指定颜色少于等值线条数时,最后一种颜色适用于超出的所有等值线。 Set lon 100 120 Set lat 10 25 Set lev 1000 Set t 1
等值线标注设置 set clab %.1f 等值线标记方式 set clab on(等值线标数值)/off(不标记)/forded(强制标记)/%gK(在标记后加上字符K)/%g%%(加上字符%)/%.2f(保留2位小数)/ %03.1f(整数部分保留3为,若不足3位,前部用0补齐) set clskip 2 每隔一条等值线标记数值 set clopts 3 0.1 0.2 等值线标记的颜色 <粗细<大小>>
标量场分析 1. 等值线 设置 set gxout contour(缺省) 2. 阴影图 设置 set gxout shaded • 阴影图 • 命令:display express • ga-> c • ga-> set gxout shaded • ga-> d strp • Contouring: 0 to 100 interval 10 • ga-> cbarn 1 0 • ga-> cbarn 1 1
3、图形显示类型及绘图设置: (1)一维:直方、折现、散点、误差图....(excel 2003) (2)二维:标量场——等值线、阴影图 矢量场——风矢量、流线图 站点—— (3) draw line/string/title/mark/……
矢量场分析——display u;v set gxout barb 风标表示的风矢量 set gxout vector 以箭头方式表示矢量场 set gxout stream 以流线方式表示矢量场
set gxout barb 风标表示的风矢量 也可以设置风向杆的颜色、粗细、大小 set gxout vector 以箭头方式表示矢量场 set arrlab on|off 设置是否标注矢量图题注(箭头) set arrowhead size 矢量图题注箭头尺寸(英寸) set arrscl <x> <y> 把<y>值矢量用长度为<x>的箭头表示 set gxout stream 以流线方式表示矢量场 set strmden value 设置流线密度[1-10],缺省为5
3、图形显示类型及绘图设置: (1)一维:直方、折现、散点、误差图....(excel 2003) (2)二维:标量场——等值线、阴影图 矢量场——风矢量、流线图 站点—— (3)draw line/string/title/mark/……
set string 1 c 2 45设置字串的颜色、位置、粗细、角度 set strsiz 0.3 0.6字水平大小、垂直大小 draw string 8 3 first group在(8,3)位置写字符串first group
set line 3 4 6 设置线的颜色、线型、粗细 draw line 3 4 5 7 从(3,4)到(5,7)画直线 draw rec 3 4 5 6 画矩形(3,4),(5,6)对角点。 draw recf 2 1 3 3 画填充色矩形(当前线色) draw mark 10 6 7 0.3 在(6,7)作大小为0.3的标记 draw polyf 5 1 6 2 6 4 画多边形 draw wxsym 2 7 7 0.5 -1 8 在(7,7)位置画大小为0.5颜色为-1粗细为8的气象符号=2
4、grads函数的使用: (1)数学函数 (2)统计函数 (3)网格处理函数 display height display hcurl(u,v) display sqrt(u*u+v*v) display u;v display qx;qy
5、grads批处理脚本 台风路径资料gs文件 6、练习