Download
1 / 51
510 likes | 526 Vues
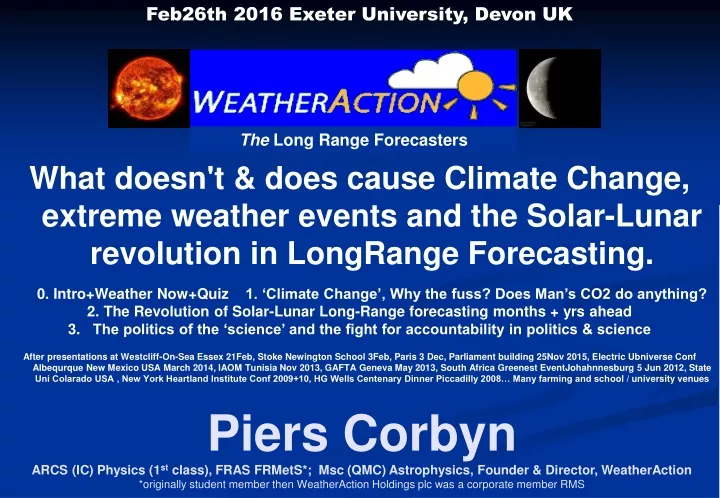
Feb26th 2016 Exeter University, Devon UK. The Long Range Forecasters. Piers Corbyn ARCS (IC) Physics (1 st class), FRAS FRMetS*; Msc (QMC) Astrophysics, Founder & Director, WeatherAction *originally student member then WeatherAction Holdings plc was a corporate member RMS.

E N D
Feb26th 2016 Exeter University, Devon UK The Long Range Forecasters Piers CorbynARCS (IC) Physics (1st class), FRAS FRMetS*; Msc (QMC) Astrophysics, Founder & Director, WeatherAction *originally student member then WeatherAction Holdings plc was a corporate member RMS • What doesn't & does cause Climate Change, extreme weather events and the Solar-Lunar revolution in LongRange Forecasting. • 0. Intro+Weather Now+Quiz 1. ‘Climate Change’, Why the fuss? Does Man’s CO2 do anything? • 2. The Revolution of Solar-Lunar Long-Range forecasting months + yrs ahead • The politics of the ‘science’ and the fight for accountability in politics & science • After presentations at Westcliff-On-Sea Essex 21Feb, Stoke Newington School 3Feb, Paris 3 Dec, Parliament building 25Nov 2015, Electric Ubniverse Conf Albequrque New Mexico USA March 2014, IAOM Tunisia Nov 2013, GAFTA Geneva May 2013, South Africa Greenest EventJohahnnesburg 5 Jun 2012, State Uni Colarado USA , New York Heartland Institute Conf 2009+10, HG Wells Centenary Dinner Piccadilly 2008… Many farming and school / university venues
Piers Corbyn began doing science at 8 years old and first published scientific papers aged 17/18 and won a Royal Scholarship to Imperial College in 1965. • Piers Corbyn’s ideas on Long Range forecasting using solar activity began in 1980s, especially 1984-85 – thanks to the Miner’s strike! • Tested by Weatherbets* with William Hill at odds decided by MetOffice 1988 to 1999 – giving significant profits (40% of stakes) (*about 30 bets at £20 each every month) • First commercial operations 1990 from Piers Corbyn in SouthBank University. Received £180,000 ~1992 from insurance industry consortium to advance research.
Independent peer-reviewed testing of forecasts (storms/insurance events) for insurance industry consortium. (Dennis Wheeler, Sunderland Uni – publication showed significant skill). • No other long range (> one month ahead) forecasting standard meteorology methods have any published proven skill. • Various commercial forms – WeatherPlan services Ltd, Piers Corbyn Weather Forecasting Services, WeatherAction Ltd • Floated on Stock Exchange AIM Nov 1997, WeatherAction Holdings plc (dotcom bubble) withdrew Dec’99 in dot.com deal resuming as WeatherAction Ltd / Piers Corbyn.
The latest Weather Events & their prediction by WeatherAction
“Storm Henry”, blizzards in Scotland & displaced polar Vortex - shown by amazing “nacreous clouds” - confirm WeatherAction 90days ahead. Storm Henry which pounded Ireland and N Britain before its effects moved to Europe confirmed Weather-Action (Slat 12c) warning 90d ahead to the day. Next amazing ‘nacreous’ clouds - associated with the ‘polar vortex’ (cold air normally around the North pole) - were seen in much of N Europe. This confirmed WeatherAction 90d ahead warning for the Polar Vortex to be displaced over Br/Ire & W Scand from around the turn of the months into Feb.
(From Idso, Carter & Singer 2015) • The claim: • “97% of scientists agree with Man-Made Global Warming” • is • IRRELEVANT and FALSE • Science is founded on observational evidence and is not an opinion poll. Observations which do not match a theory mean the theory FAILS no matter any opinions or the grandeur of the supporters. • The “Surveys” commonly cited are without exception methodologically flawed and often deliberately misleading. • No study shows consensus on the key issues in the climate debate. • Most articles of 928 surveyed simply reference or assume claims of the UN-IPCC & go on to address different topics, eg life-cycle of frogs. • Of all papers examined by the same search term as Oreskas (main quoted survey) 2004-Feb 2007 ONLY 7% explicitly endorsed the view.
QUICK QUIZ • • What are the assumptions of normal standard meteorology? • = Weather drives weather • • What can’t it explain / do? • Signals in weather and Climate (22yr, 60yr, 155day, 27day… ENSO, QBO, Lunar…) • - Long Range forecasts • Climate Change, ice ages • • How much CO2 is there?
Breaking the CO2 Global-Warmist Delusion – THE FACTS How Much Little CO2 is there in the atmosphere? Compare the atmosphere with Big Ben’s Tower – 316 ft high CO2 in the atmosphere is equivalent to 1¼inches on top Man’s contribution is aboutOne mmin that. Or about 0.04% Termites produce TEN times as much CO2 as ALL man’s output! Termites & CO2 - FACTS • Termites produce more CO2 each year than all other living things combined.•Will there be a War on Ants? • It is estimated that for every human on Earth there may be 1000 pounds of termites. http://www.termitedetector.com/detection.cfm **ALSO See other presentation pdfs & Videos viawww.weatheraction.comeghttp://www.weatheraction.com/displayarticle.asp?a=222&c=1
How do we know it’s NOT CO2? • It’s NOT because of the meddling with data, fraud, tricks, fictional claims and suppression of evidence and arguments which oppose the CO2 theory – exposed in CLIMATEGATE • It’s because theCO2 theory FAILSin ALL it’s predictions and expected past correlations. • Climate change is a natural process and is not new! • Temperatures control CO2 NOT the other way • No increase in extreme events with CO2 • ALL predictions of CO2 “theory” have failed • The “theory” itself is based on a conjuring trick etc (confusion of rates of change with total change, non equilibrium systems, transpiration cooling….)
WHY THE CO2 ‘THEORY’ FAILS • FACTThere is no evidence for the CO2 climate driver proposition in the real world using real data over hundreds of thousands of years. World temperatures do not follow CO2. Give the warmists no quarter! • The world is not warmingand has not been doing so for 18 years. Even under fraudulent UN-MetO-NOAA manipulated data the world is not warming. ALL the alarmist predictions of CO2 warmism have failed. • Seehttp://www.weatheraction.com/docs/WANews14No11.pdfandlinks in Article about BBC-MetO charlatan John Hammond's Science Denialist claims, in WeatherAction blog http://bit.ly/1xKYPrJ(sec3) • FACTChanging CO2 has no effectEVEN the Models used by the Met Office and UN's Climate Committee (the IPCC) show CO2 levels have no effect on the Jet Stream or extremes which come from the Wild Jet stream changes which they fail to predict.It is meteorological fact that the recent very wild weather extremes and contrasts follow from wild Jet Stream behavior. THAT Wild Jet Stream (Mini-Ice-Age) behavior was and is regularly predicted by Piers Corbyn's Solar-Lunar approach and is nothing to do with CO2. Seehttp://www.weatheraction.com/docs/WANews14No06.pdf& Piers' videohttp://bit.ly/QS0k34The claim that these extremes are driven by CO2 / man made Climate Change is a lie for which there is no evidence or scientific paper which demonstrates a link in the real world. • 2. FACTEven if CO2 had an effect the idea that Man’s 4% of total CO2 flux rules the other natural 96% flux in and out of sea/land requires a conspiracy of nature to follow man’s activity. This is deranged. • It follows War should be declared on termites which emit 10x Man’s CO2 equivalent. • 3. FACTThe reason why the CO2 atmosphere theory can never work is that the Ocean-atmosphere interface controls the amount of CO2 in air – a warmer ocean emits CO2 and vice versa. • Ocean temperatures CONTROL atmospheric CO2 levels. It is an observed fact in millions of years of data that Ocean temperature changes LEAD atmospheric CO2 changes. There are 2 other reasons why CO2 warmist theory must fail: a) the effect of plants b) Non equilibrium thermodynamics in the atmosphere - ie the assumptions of the ‘theory’ are nonsense.
The CO2 Warmist scares have comprehensively failed THEY TOLD USin 2000:WHAT HAPPENED Dangerous climate change within decade or so: from around 2007 to 2013 World runaway warmingThe World got colder While CO2 went up Droughts & Heatwaves UKFloods, cold & Hail The End of Snow by 2010 UKDramatically more snow More USA Hurricanes Less USA Hurricanes World massive Ice melts MORE World ice, & Dishonest reporting of Arctic Springs Eu UK USA earlierSprings LATE & COLD! Large Sea level rise NO - Same slow rise since last Ice Age NOW THEY SAY WARM IS COLD!!
POLITICAL HURDLES The Climate Change Act 7 yrs on - New understanding of Climate Change - Energy charges & saving British Steel SEVEN years on from the passing of the Climate Change Act 2008 it is clear weather in the world and UK has not moved in accord with the assumptions of The Act. Satellite observations show the world has cooled and the (N Hemisphere) Jet Stream moved south and become wild and wavy - the opposite to the expectations of the science involved. It is now time to REVIEW the application of The Act in accord with Section 6 clause 2 which states as the science & data develops so the CO2 targets may change.
The UN (IPCC) Forecasts have comprehensively failed At the Oct 27 2010 meeting Piers said: “Philip Foster (1st presentation) already gave graphs that show there is NO EVIDENCE going over millions of years that CO2 controls temperature. These graphs shows the IPCC predictions do not accord with the facts. That means the theory fails. The University of East Anglia (CRU) however instead changed the facts. This is unacceptable” In 2010 Warmist opinion admitted World temperatures (Surface obs) were falling since then they have changed (“adjusted”) past data to hide that fact.
WeatherAction Myth Buster - Redistribution encouraged They Changed the FACTS! Warmists have been fiddling (“selecting”) data for years – • systematically removing stations to make the data look colder in the past & warmer now •BUT Whatever they do, even with ‘new’ data the WORLD IS COOLING while CO2 still rises This is where honest data would be; about0.5C below official. Under fiddle-corrected data recent peaks are about the same as ~1935-40 peak; ie NO WARMING About 0.5C of trickery. (Range 1975-2000Redline minus Black)
The World Meteorological Organization, NASA and National Met Services have been data tampering for years – They Changed the FACTS! •A false rise of 0.6C has been added into data 1880 - 2016 •Official bodies avoid satellite data which shows the world is now cooling
CO2 & temperatures moved close together through the last 4 ice ages. Temperatures LEAD CO2 by ~800 yrs. Al Gore doesn’t tell you That Inconvenient Truth! Note Rapid ‘spikes’ in CO2 levels are diffused away in ice cores and not visible in data Depth (m) Time Close examination (eg see red boxes) of proxy Temp & CO2 data in ice cores show Temperatures lead CO2 changes. Changes across Antarctica termination III (Caillon et al Science March 2003) 240k yr ago show Temperature leads CO2 by on average 800+/-200yrs 43k yr tilt and 26k yr precession key
Temps drive CO2 as ice ages end. Fast CO2 changes (like now) are hidden At a meeting Piers said: “There is just one timescale where CO2 & temperature correlate well, that is on averages of about a hundred years; BUT this shows TEMPERATURES CONTROL CO2 which changes AFTER temperatures have changed” At the end of the last ice age temperature changes LEAD CO2 by 800yrs Similar leads are in Antarctic Termination III 240kyr ago(Caillon et al Science Mar 03) CO2 diffuses through ice CO2 data points are at best 200yrs apart and show only small variations between points. This is because CO2 is a gas and diffuses into centuries of ice layers. The present CO2 spike will amount to a mere blip in 1,000yrs time. There is No Evidence that the present CO2 rapid rise is unique. Time Inconvenient Truths for GW Orthodoxy!
CO2 theory does not work THEORY of HOTSPOT OBSERVED COLDSPOT Info Thanks to: http://sciencespeak.com/MissingSignature.pdf by David Evans
Global Temperature and Atmospheric CO2 over 600 Million yrs - No Evidence of CO2 driving temperature Late Carboniferous to Early Permian time (315 million years ago - 270 million years ago) is the only time period in the last 600 million years when both atmospheric CO2 and temperatures were as low as they are today (Quaternary Period). At no point do temperature and CO2 levels relate. Temperature after C.R. Scotese http://www.scotese.com/climate.htm CO2 after R.A. Berner, 2001 (GEOCARB III)
The CO2-Warmists “Theory” of extreme weather events – GW is renamed Climate Change! The theory of ‘Global warming’ holds that Man’s CO2 causes Global Warming and this causes other Climate Change and extremes. CO2 Global Warming Climate Change We have heard a lot about weather extremes & ‘Climate Change’ Since 1998 CO2 has gone up but World Temperatures have gone down. ALL subsequent years* have been colder than 1998 Or In terms of two year moving averages the peak was 2002/3 *From Official estimates of world temperatures:http://www.cru.uea.ac.uk/cru/data/temperature/hadcrut3vgl.txt So there are claimed extra effects – ‘Climate Change’ - without temperature rise to cause them! AND post Industrial revolution CO2 has NOT caused ANY change that wasn’t going to happen anyway!
What does Global warming / Climate Policy eg of UN IPCC / UK Climate Change Act 2008 achieve? 1. It does NOT reduce CO2 production but re-locates it – eg the transfer of Steel production from Teesside to India simply exports CO2 production. Wind-Farms use coal-fired back-up for when the wind doesn’t blow. 2. The economic effects are catastrophic: - Destruction of manufacturing jobs in UK, Sweden, Finland….(not usually German industrial capital) - Growth of phoney casino economy of asset stripping and finance capital 3. Pushing up energy and Oil prices Note Big Oil back Man Made Climate Change policies (see BP web site) “providing a uniform price for carbon is maintained” (ie govt backed price hikes to help oil profit). Aljazeera the biggest Climate Change propaganda TV on the planet is owned by Oil state Qatar. 4. Emasculation of the left – Red pro-coal-pro NUM anti nuke campaigners are now green anti-coal pro nuke.
The closure of UK Coal, steel and other industries is a direct result of Climate Change policies & Eu Rules TATA Steel (India) bought Corus Redcar not to save it but to grab the Carbon Credits (worth £1billion) on closure of the plant and use them to expand steel production elsewhere backed by UN hand-outs. Vera Beard MP “tried” to keep the Carbon credits for use in the UK but Eu RULES STOPPED IT (ETS, Emission Trading System). Photo Lou Mackenzie
What should you do? • ENJOY life! Enjoy the planet! • Don't feel guilty about ‘carbon footprints’. • CO2 is the Gas Of Life (GOL)! More GOL increases plant & animal life. • GOL (CO2) IS NOT A POLLUTANT. MORE CO2 IS GOOD NOT BAD!!!! • 2. Accept Man can’t change Climate! • The Problem is Climate Change POLICY. ‘Climate Science’ lacks integrity. Prove & predict! Standards of science must apply to Climate. • 3. STOP Carbon reductions, Carbon Tax & Trading • => SAVE UK STEEL <= • NO PRAYER WHELLS (Wind farms) • MONEY BACK on Green Electricity Charges - Theft • Your electricity bill has gone up 25% for the Green Con and is set to double • 4. KEEP honest green policies to reduce smoke & chemical pollution and defend biodiversity. • 5. USE LONG RANGE Scientific Solar-Lunar Weather Forecasts & Prepare for the developing Mini Ice Age
Piers Corbyn’s Solar-Earth-Weather Science is advancing all the time. • Solar Weather Technique (SWT) now Solar Lunar Action Technique (SLAT) Basic idea is solar activity (particle and magnetic effects), modulated by Lunar factors affect Jet Stream and weather developments on hourly, daily, annual, decadal and centuries time scales.
World Temperatures or ANY weather parameter or pattern/relationship/correlation are essentially driven by (modulated) solar effects Or any other weather parameter / pattern
http://www.ashevilletribune.com/asheville/global%20warming/Global%20Warming%20DM%20Main%20Story%20March%2031%20Update.htmhttp://www.ashevilletribune.com/asheville/global%20warming/Global%20Warming%20DM%20Main%20Story%20March%2031%20Update.htm The reality of the Medieval Warm period was accepted by (Sir) John Houghton in 1990. For this and the ongoing rise of CO2 over the last 8,000 yrs (UN figures) see the ‘Gang of 13’ letter to UN: http://www.tech-know.eu/uploads/Letter_UN_Sec_Gen_Ban_Ki-moon.pdf Martin Munro Tree Rings 2004 Mann etal 1999 GephysResLey
Double sunspot eruption Sudden Ionospheric Disturbance Jet stream shifts Russia heat & Pakistan superdeluges end On the morning of 14th Aug a TWO sunspot solar flare (C4 class) erupted hurling plasma and X rays to Earth for two hours causing a simultaneous major SID - Sudden Ionospheric Disturbance (X rays travel Sun-Earth in 8 mins) and then the jet stream shifts and dramatic weather changes across the world as predicted. See http://www.youtube.com/watch?v=9M7x-IMj9d8 for video from http://spaceweather.com/archive.php?month=08&day=15&year=2010&view=view. Apart from the dramatic changes in Europe, Russia and Pakistan there were other major weather events in the period 15-19th Aug associated with the predicted jet stream changes. - There were continuing huge deluges, massive floods and landslips in China – eg http://bbheavy rain c.in/cv9RDt 15th Aug Double Sunspot superfast very powerful coronal ejection 2010 14th Aug 10:05zhttp://www.youtube.com/watch?v=9M7x-IMj9d8Sudden Ionospheric Disturbance peaks 15mins later Jet Streamdramatic shift starts 12hr later. Thunderfloods hit St Petersburg afternoon 15th. Extreme events around world. SEE http://squall.sfsu.edu/scripts/nhemjet_archloop.htmlCHOOSE start 13th Aug 00z, 5days, 6hrs steps
http://www.weatheraction.com/docs/WANews10No31.pdf We TOLD YOU so – It’s NOT CO2! Piers Corbyn astrophysicist of WeatherAction predicted the heatwaves in East Europe & WestRussia in his Euromaps long range forecasts - http://bit.ly/bNMJ77 On 3 Aug Piers warned – see http://bit.ly/beo5YQ - that the deadly heat in West Russia & deadly floods in Pakistan would largely continue until mid-August, then decline and next decrease sharply. On 8 Aug he gave more detail: http://bit.ly/cIdTSa “(85% confidence) both the Pakistan deluges and the West Russia heatwave will continue to mid August and probably INTENSIFY for a day or so around the dates August 8th, Aug 10th and most notably Aug14th/15th after which both the Pakistan deluges and Russia heat will markedly decline in ferocity. For Pakistan however significant floods downstream in the great rivers will continue for about 5 days. Could world wheat crisis have been averted? Will Russia & Pakistan be hit again next year? Is SatelliteGate the end of Global-Warming religion? Long-range forecasts by Piers Corbyn using his Solar-magnetic and Lunar effects Technique correctly forecast the West Russia heatwave and correctly predicted when the Jet stream would undergo a dramatic world shift and end both the Russia heatwave & Pakistan SuperDeluges. Russia heat ends as forecast Piers said “We are very pleased with this result. I explained on Russia Today tv http://bit.ly/95jvqfthat these events were driven by solar-magnetic lunar cycles which is why there were similar events around 132 years earlier. We warned (eg in video of 31 July http://bit.ly/bFpB2z ) that the most significant extreme events across the world this August would be around 15th/16th August - as part of 15th-19th RED WARNING - eg EuroMaps & Brit /Ire forecasts http://bit.ly/bNMJ77and part of a general world shift in the Jet-stream. There were many very dramatic events in this period (see over) including massive deluges in St Peturburg 15th August starting the end of the heatwave http://bbc.in/bN3e7D in a manner which closely matches our forecast - see Video by Nina Ridgehttp://bit.ly/bGHNr2 & http://bit.ly/a92lCd There were also major deluges in France, across Europe and in SE England Channel 4 TV’s big brother house flooded on 18th Aug http://bit.ly/cRT0VP . The dramatic penetration of the jet stream (grey bits) into West Russia on 16th-18th is clear in the jet stream flicker-movie http://bit.ly/dtjaIp (archives) Pakistan floods drop as forecast “In Pakistan, as we warned, there were ‘last blast’ extra deluges around 15th which caused new floods – eg in Dadu-Moro http://bit.ly/cJqfwY (click) and in next day or so then a general change to less deluges in Pakistan is following as the Low pressure in the Arabian sea filled {see 18th Aug Pressure map - http://bit.ly/9wBJFb compared to situation around Aug 2ndhttp://bit.ly/bvIuP4 } and the whole world jet stream transforms to a new state as predicted by the Solar Lunar Action Technique. The landslide in Puladi, a settlement in Yunnan province, was the latest of a succession of natural disasters to have struck China this summer after torrential downpours unleashed floods and dislodged hillsides. Accuweather reported major thunderstorms (+ tornado risk) in period 15-19th in USA Midwest, Gulf, Ohio, Central plains, Boston-Washington, Oklahoma, N Plains, Louisiana Lighting downed a plane on San Andres island Colombia (in Gulf off Nicaragua) 16Aug http://bit.ly/9ANEtJ In line with Piers Corbyn’s detailed long range forecast storms battered St Petersburg Sunday 15th Aug before moving towards Moscow as the jet stream changed as predicted. In Pakistan there were also extra deluges then marked abatement of rain as weather patterns changed as predicted. http://www.telegraph.co.uk/news/picturegalleries/worldnews/7954351/China-extreme-weather-floods-and-landslides-in-pictures.html?image=8
There are many signals in weather data all(?) solar/lunar in origin – 155d, 11yr, 22yr…
Beats between Lunar-nodal crossings (9.3yr) & the magnetic (~22yr) cycle of the sun drive the ~60yr modulation of Jet Stream shifts and the prevalence many circulation patterns.
There is NOTHING fundamentally new in weather. It has essentially all happened before. Similar Sun-Earth-Magnetic-Lunar states give similar circulation/weather Look-Back periods tell when to look in the past for weather (1 factor) corresponding to similar future Solar-magnetic-Lunar states. …=>…=> ...=> Sun-Earth (modulated) state..=> …=>…..=>...=> ……=>…Total (world) Weather state…..=> …=>…..=>…..=>…..
Instead of a super-computer SLAT uses the whole sun-Earth-moon-etc system as its own computer and applies the principle similar input =>similar output The existence of solar-Lunar signals in weather data is evidence that similar input => similar output HOLDS; ie THE SOLAR-LUNAR DRIVER IS ESSENTIALLY NOT CHAOTIC SLAT could choose between ensemble options Solar-Lunar DRIVER F(t) – SLAT Equations & Rules SLAT could modify the computing process in real time R5/R4 Earth Weather State Synoptic data sets Weather Future Ensemble of Possible Futures World Weather response Computer Model and programme Extreme solar “Red” Period Effects R5/R4 predictably CHANGE Futures
MATHEMATICALLY SWT / SLAT is different from Standard Meteorology of very large Partial Differential Equations (DE) = F(t), driving force F(t) Standard Meteorology solves DE = 0, Transient Y=TS SWT / SLAT “Solves” (conceptually) DE = F(t) ie the particular integral Y=PI / ‘Steady state’ solution Y= TS + PI is total solution. For time scales t > tc when size of driving signal is larger than typical decayed meteorological disturbance (noise) PI dominates and endless computer power solving DE=0 is of no further benefit. Typically tc ~ 5 days
SLAT works on Earth because typical weather noise is less than the size of F(t) on time scales which are useful (ie days, if it was years SLAT wouldn’t be so useable) Without adjustments for Solar-Magnetic effects modulated by Lunar factors (as described by SLAT) even the best Earth-based (“weather causes weather”) models will be inaccurate on time scales beyond about 5 days. Assumed persistence of phenomena such as El Nino does not fundamentally alter this basic weakness although they can ‘advise’ months ahead.
WeatherAction significant Long Range (weeks+ months) forecast successes with detail where applicable to a few days include:- • Wet summers Britain & Ireland 2007, 2008, 2009 (when UK MetOffice predicted 'BBQ' summers!);- West Russian Heatwave and the date of it's ending in August 2010;- UK coldest (and very snowy) December for 100 years Dec 2010;- Extreme deadly tornado swarms eg Joplin Missouri USA May 2011;- Hurricane Irene USA East coast predicted in detail 12 weeks ahead;- The year without a summer - extreme deluges and hail - Britain & Ireland 2012;- Very Extreme deluges and hail July 2012 USA and Europe;- V late Spring BI 2013 (WA won British Asparagus Assoc competition for market readiness);- Late Oct Storm ('Piers Corbyn's Storm) S England +NW Europe 28Oct 2013, predicted 6mth ahead;- Extra-ordinarily cold (displaced polar vortex) Winter/Springs 2014 and 2015 (East) USA+S Canada. NONE of the above were predicted long-range by any other forecasters. EXAMINED IN CATEGORIES…..
SEASON / MONTH MAJOR EXTREMES When SWT / SLAT Met O / Standard Met SLAT MO Summer 2007 FLOODS BBQ summer 1 0 Summer 2008 FLOODS BBQ summer 1 0 Summer 2009 FLOODS BBQ summer 1 0 Dec 2010 Coldest 100yrs Mild / unclear YES Summer 2012 Floods deluges Fine? YES Spring 2013 Very LATE Early Spring? YES SLAT forecasts mostly months ahead; except Dec 2010 a week or so before start of Dec SWT / SLAT Very skilled
Weather in 21st Century - Answers • Weather extremes of recent years are part of natural essentially predictable processes* • Severe summer floods 2007, 2008, 2009not 2010 & 2011(Scot)2012! • like very wet summers 1875, 1876, 1877not 1878 & 18791880 ! • - associated with the approx 132 yr pattern* : 6X22=132, 7X19=133 • The 2007, 2008, 2009, 2011 and 2012summer floods were predicted in detail by the SWT/SLAT. This flood-likely summers situation can continue for a few years but is SUBJECT TO other conditions (SWT) being satisfied. • The Russian superheatwave & Pakistan superduluges were also preceded by similar events ~132 years before - 1878 • *First explained by Piers Corbyn to Imperial College Union President’s centenary dinner 27 July 2007. The slow sea level (volume) rise - 6 inches per century - will continue** even as world surface cools. It is just ocean volume expansion due to ongoing warming of the deep ocean (which is still cold) since the end of the last ice age 10,000 years ago. NOTHING TO DO WITH CO2!{**notwithstanding changes in ocean floor shape such as the appearance of trenches and sumps in the Pacific as the Indian sub-continent pushes up the Himalayas and drive Tsunamis}
The Apocalyptic deluges of July 2012 were well captured in WeatherAction DETAIL 45-75d ahead
WeatherAction well captured the cold late “Jet-Stream South” Spring 2013 & won the British Asparagus award for the date to market of field Asparagus – 5week delay.
Extreme Storms – The two most significant storms hitting Britain / Ireland in last 3 yrs Oct 28th 2013 South / SE England (Storm Jude) predicted by WeatherAction 5 months ahead at GAFTA (Grain and Feed Trades Association) conference Geneva 28-30 Dec 2015 (Storm Frank) Ireland + Britain predicted by WeatherAction 10 weeks ahead SLAT got both very well. Met Office had good detailed short range forecasts for both in terms of timing and general track. However significantly eg Oct 2013 WeatherAction correctly warned MO would underestimate storm power. WA also gave a small correction to track which was confirmed. (Same method applied to Hurricane Irene) SWT / SLAT Very skilled in Long Range storms and timing. SLAT can also improve on MO Short Range
- The S/SE Uk Storm of Late Oct 2013 (St Jude) was first announced by WA at GAFTA conf Geneva 15-17 May – over 5 months ahead St Jude 28th Oct, 99mph gusts (storm force 11) measured at the Needles on Isle of Wight; hit Denmark - gusts of 121mph (Hurricane force 12). Further details released in ‘45 day’ forecast Sept 17 left & below (front page)
WeatherAction 21 Oct 2015 warned of a major storm 28-31 Dec (70d ahead). Storm Frank formed 28 Dec & hit Uk 29-30th with hurricane force winds at sea & Dec max land gust 78 mph at Magilligan on 30th.
TopRed Warning: “Mega storms will hit across world around 28-31 Dec due to Top Level, R5, solar factors - forecast 10 weeks ahead” – Piers Corbyn Short Range charts both sides of the Atlantic confirm WeatherAction solar-based warnings. This is http://www.weatheraction.com/docs/WANews15No29.pdf Amazing Xmas period 80%OFF Deals BI,Eu,USA SUBSCRIBE NOWwww.WeatherAction.com WeatherAction Long Range forecast notes first made 10 wks ahead warned of a “Top Red (R5)” period around 28-31 Dec which through extra solar activity would drive major storms worldwide. Forecast patterns BI+Eu (from choices 21Oct) such as very deep Lows (Atlantic & USA) are showing in real weather systems although the deep Atlantic Low might not penetrate Scandinavia as first forecast. There will be other extra extreme storm/ Tropical cyclone events in the world. The graphs warn of Floods & wind damage