Download
1 / 1
20 likes | 158 Vues
Multivariate Data Analysis with T MVA 4. Monte Carlo. “limit” in ROC curve given by likelihood ratio. 1. x 1. TMVA core developer team: A. Höcker , P.Speckmayer , J.Stelzer , H.Voss ; arXiv physics/0703039. better classification. good classification. minimization. x 2.

E N D
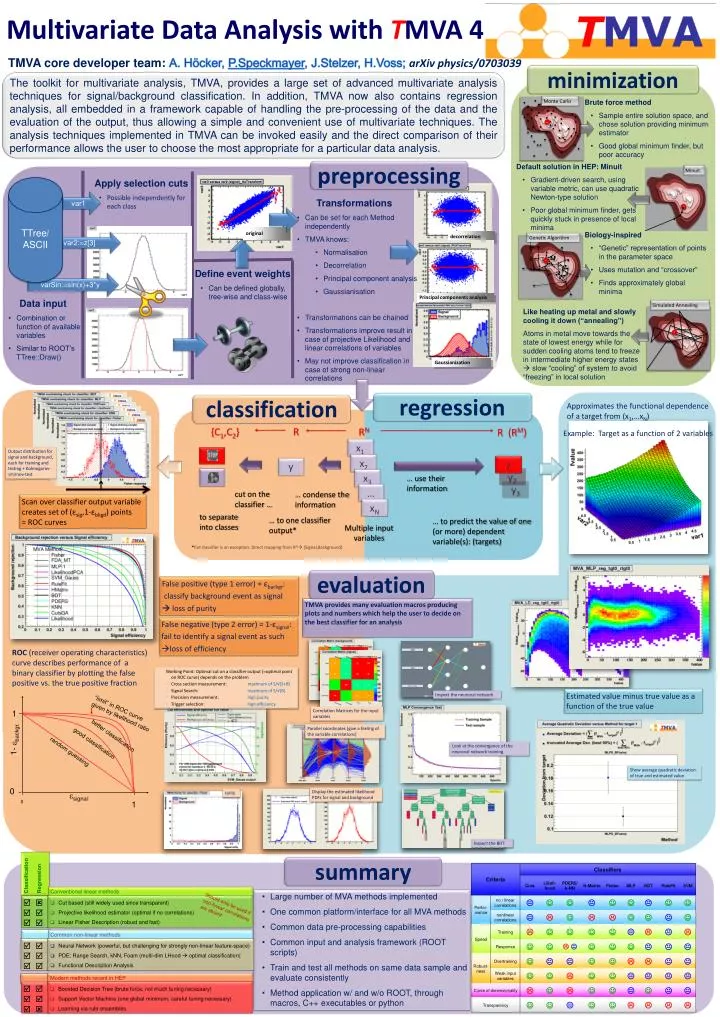
Multivariate Data Analysis with TMVA 4 Monte Carlo “limit” in ROC curve given by likelihood ratio 1 x1 TMVA core developer team: A. Höcker, P.Speckmayer, J.Stelzer, H.Voss; arXiv physics/0703039 better classification good classification minimization x2 1- ebackgr. random guessing The toolkit for multivariate analysis, TMVA, provides a large set of advanced multivariate analysis techniques for signal/background classification. In addition, TMVA now also contains regression analysis, all embedded in a framework capable of handling the pre-processing of the data and the evaluation of the output, thus allowing a simple and convenient use of multivariate techniques. The analysis techniques implemented in TMVA can be invoked easily and the direct comparison of their performance allows the user to choose the most appropriate for a particular data analysis. x3 … 0 esignal 0 1 xN preprocessing • Apply selection cuts • Possible independently for each class TTree/ ASCII var1 • Transformations • Can be set for each Method independently • TMVA knows: • Normalisation • Decorrelation • Principal component analysis • Gaussianisation • Transformations can be chained • Transformations improve result in case of projective Likelihood and linear correlations of variables • May not improve classification in case of strong non-linear correlations Minuit • Brute force method • Sample entire solution space, and chose solution providing minimum estimator • Good global minimum finder, but poor accuracy original var2:=z[3] Simulated Annealing decorrelation Genetic Algorithm • Define event weights • Can be defined globally, tree-wise and class-wise • Default solution in HEP: Minuit • Gradient-driven search, using variable metric, can use quadratic Newton-type solution • Poor global minimum finder, gets quickly stuck in presence of local minima varSin:=sin(x)+3*y • Data input • Combination or function of available variables • Similar to ROOT’s TTree::Draw() Principal components analysis • Biology-inspired • “Genetic” representation of points in the parameter space • Uses mutation and “crossover” • Finds approximately global minima Gaussianization regression • Approximates the functional dependence of a target from (x1,…xN) classification • Like heating up metal and slowly cooling it down (“annealing”) • Atoms in metal move towards the state of lowest energy while for sudden cooling atoms tend to freeze in intermediate higher energy states slow “cooling” of system to avoid “freezing” in local solution • Example: Target as a function of 2 variables R {C1,C2} RN R (RM) Output distribution for signal and background, each for training and testing + Kolmogorov-smirnov-test y y y2 … use their information Scan over classifier output variable creates set of (εsig,1-εbkgd) points = ROC curves y3 cut on the classifier … … condense the information to separate into classes … to one classifier output* … to predict the value of one (or more) dependent variable(s): (targets) Multiple input variables *Cut classifier is an exception: Direct mapping from RN {Signal,Background} evaluation • False positive (type 1 error) = εbackgr: • classify background event as signal • loss of purity TMVA provides many evaluation macros producing plots and numbers which help the user to decide on the best classifier for an analysis • False negative (type 2 error) = 1-εsignal: • fail to identify a signal event as such • loss of efficiency • ROC (receiver operating characteristics) curve describes performance of a binary classifier by plotting the false positive vs. the true positive fraction Classification Regression • Working Point: Optimal cut on a classifier output (=optimal point on ROC curve) depends on the problem • Cross section measurement: maximum of S/√(S+B) • Signal Search: maximum of S/√(B) • Precision measurement: high purity • Trigger selection: high efficiency Conventional linear methods • Estimated value minus true value as a function of the true value Inspect the neuronal network • Cut based (still widely used since transparent) • Projective likelihood estimator (optimal if no correlations) • Linear Fisher Description (robust and fast) • • • Should only be used if non-linear correlations are absent Correlation Matrices for the input variables Parallel coordinates (give a feeling of the variable correlations) Common non-linear methods • Neural Network (powerful, but challenging for strongly non-linear feature-space) • PDE: Range Search, kNN, Foam (multi-dim LHood optimal classification) • Functional Description Analysis • • • Look at the convergence of the neuronal network training Show average quadratic deviation of true and estimated value • Modern methods recent in HEP • Boosted Decision Tree (brute force, not much tuning necessary) • Support Vector Machine (one global minimum, careful tuning necessary) • Learning via rule ensembles • • • Display the estimated likelihood PDFs for signal and background rarity Inspect the BDT summary • Large number of MVA methods implemented • One common platform/interface for all MVA methods • Common data pre-processing capabilities • Common input and analysis framework (ROOT scripts) • Train and test all methods on same data sample and evaluate consistently • Method application w/ and w/o ROOT, through macros, C++ executables or python