Download

1 / 32
340 likes | 719 Vues
MONTHLY MONITORING REPORT. A GUIDE ON HOW TO ACCOMPLISH THE REPORT August 2000. MONTHLY MONITORING REPORT. DIVIDED IN TWO SECTIONS PERFORMANCE DATA STATEMENT OF INCOME AND EXPENSE PERFORMANCE DATA SHOW STATUS OF PRODUCT IMPLEMENTATION

E N D
MONTHLY MONITORING REPORT A GUIDE ON HOW TO ACCOMPLISH THE REPORT August 2000
MONTHLY MONITORING REPORT • DIVIDED IN TWO SECTIONS • PERFORMANCE DATA • STATEMENT OF INCOME AND EXPENSE • PERFORMANCE DATA SHOW STATUS OF PRODUCT IMPLEMENTATION • INCOME & EXPENSE STATEMENT SHOWS PRODUCT INCOME FOR THE PERIOD.
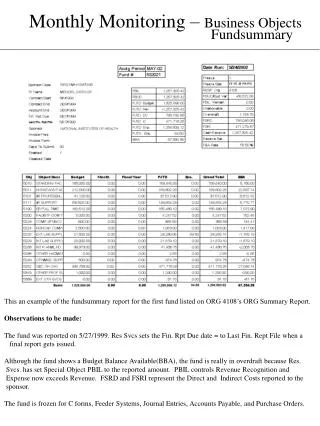
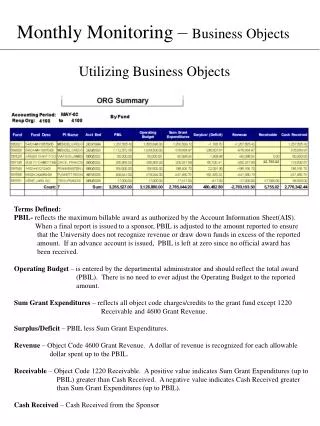
SOURCES OF DATA • Performance Data are from the MIS Reports. • Performance Report, by Account Officer • Portfolio at Risk (PAR) Report • Delinquency Report • Statement of Income and Expense • Financial Income comes from the MIS report on Income Earned • Branch FS for the month to estimate share of product in branch operating expenses • Product Business Plan for targets.
“As of end of the month data” # Active Borrowers Loan Portfolio Balance Amount Past Due # Accounts with Amount Past Due Portfolio at Risk # DepositorsOutstanding* Total Deposit Balance* “For the month” data # New Borrowers # Repeat Loans # Loans Disbursed during the month # New Borrowers PLUS # Repeat Loans Amount Disbursed during month Amount New Loans PLUS Amount Repeat Loans Performance Data
Performance Data • Cumulative data • Cumulative # of Loans Disbursed: ADD • # of loans disbursed during the month • Cumulative # loans disbursed PREVIOUS MONTH • Cumulative Amount of Loans Disbursed: ADD • Amount of loans disbursed during the month • Cumulative amount of loans disbursed previous month
Performance Data: *Deposits... • Indicators: # of Depositors and Deposit Balance Outstanding are from the Quarterly PDIC Report, which shows the number and deposit balances by deposit size. • These two indicators are updated in the Monitoring Report every quarter.
Establish the baseline quarter. Say, if the branch started with MABS in June ‘00, the baseline quarter is March ‘00. The relevant data are those pertaining to deposits P15,000 and below. The report for June will thus reflect: June data Less March data Performance Data: *Deposits...
Performance Data... • Amount Past Due: • DIVIDE Amount of Missed Payments by Total Portfolio Balance • No. of accounts with an amount past due: --COUNT all accounts with missed payments
Performance Data... • Portfolio at Risk (PAR): Balance of accounts with missed payments. • PAR 1 day or more = total outstanding balance of all accounts with PAR • PAR more than 7 days = total balance of all loans with payments missed more than 7 days.
Performance Data: PAR... • % PAR 1 day or more: • (Divide PAR 1 day or more by the Total Loan Portfolio) X 100 • % PAR more than 7 days: • (Divide PAR 7 days or more by the Total Loan Portfolio) X 100
Total Financial Income: ADD Interest income Service charge Penalty fee Total Financial Expense: ADD Interest expense on deposits Interest expense on borrowings INCOME & EXPENSE
Income & Expense... • Gross Financial Margin (Spread) • Total financial income MINUS • Total financial expense
Income & Expense... • Provisioning varies depending on the # of days payments had been missed. • Loan loss provision, by age of PAR • 7 days & below 2% • 8 -15 days 10% • 16-30 days 25% • 31-60 days 50% • 61 & over 100%
Income & Expense... • Net Financial Margin • Spread MINUS Loan Loss Provision • Operating Expense Components • Direct Expenses attributable to the Product • Indirect expenses: Share of Product in other expenses incurred by the branch (these are expenses the branch would have incurred with or without the Product).
Direct or Incremental Expenses • Micro-finance salaries = Basic plus Benefits Ex.: AO basic = P4,500/month; Benefits = 70% of basic. # AO s = 3 P4,500 * 1.70 * 3 = P22,950 • Transportation: Expenses incurred by the MFU staff for motorcycle gasoline & oil, jeep or tricycle fares reimbursed by AO s.
Direct or Incremental Expenses... • Gross Receipts tax: 5% of Total Gross Income • Direct Depreciation on equipment, software, tables & chairs, motorcycles, etc. used by MFU 100% • Use the depreciation policy of the bank • Depreciation period for pieces of computer equipment is usually 24 months; motorcycle, 36 months.
Indirect Expenses • Represent the share of the Product or MFU in the other expenses of the branch. • To get the % share of the Product: Example # Loans #Deposit accts Total MF Product 150 477 627 Total Branch 2,801 10,151 12,952 % Share MF 627/12952 = 4.8%
Indirect expenses (con’t) • Apply the % share of MFU to the other expenses incurred by the branch for the month. • To get branch expenditure for the month, • Current month’s expense LESS Previous months expense for the cost item • Then, expense for the month by the MFU % share to get the amount chargeable to MFU.
Financial Expense: How to Compute • Case 1. Funds comes solely from Deposits. Data Needed: (Example) • Interest Rate on Deposits : 5% p.a. • Total deposit liabilities : P600,000 • Reserve reqts. for deposits : 2% • MFU Portfolio previous month : P350,000 • MFU Portfolio current month : P500,000 Determine the cost of funds.
Case 1. Funds from deposits • To get financial expense (FE), say for May: FE = (Avg. portfolio x 5%) x 31days/365 days (1 minus 2% or .02) • To get avg. portfolio (AP): AP = (MFU Portfolio previous mo. + MFU Portfolio current mo.)/2
Case 1: Funds from Deposits... • To illustrate: AP = (350,000+500,000)/2 = 425,000 FE = (425,000 x .05) x 31/365 (1-.02) = (21,250 x .0849)/ 0.98 = 1,804/0.98 = P 1,841
Case 2. Funds From Borrowings Data needed: • Interest rate on borrowed funds (ex. PCFC=13% p.a.) • MFU Loan portfolio end of previous month • MFU Loan portfolio end of current month Get Average Portfolio (AP) for the month. AP = Portfolio previous mo. +Portfolio current mo. 2 Calculate Financial Expense (FE): FE = (AP x 13%) x # days in month/360 days
Case 2: Funds Solely from Borrowed Funds • For example: • AP previous month = 350,000 • AP Current month = 500,000 • Interest rate on funds = 13% p.a. • FE = (350,000+500,000)/2 x 13% x (31/360) = 425,000 x 0.13 x 0.0861 = P 4,757
Case 3: Funds are from Deposits & Borrowings • Data needed from Branch FS • Interest expense -- Deposits Branch • Interest expense -- Borrowed Funds Branch • Total Deposit Liabilities of Branch • Total Borrowed Funds of Branch • Other data needed • Reserve Requirements on Deposits (2%) • Product Loan Portfolio ( from MIS)
Case 3. Deposits & Borrowings... • To illustrate, consider the following data: Interest Expense--Deposits: 49,758 Interest Expense--Bor.Funds: 160,000 Total Deposit Liabilities: 12,636,617 Total Borrowed Funds: 18,312,790 Reserve Requirement : 2% Product Loan Portfolio: 722,933
Case 3: Deposits & Borrowings… Share in Total • Get the total of deposits & borrowings: 12,636,617 + 18,312,790 = 30,949,407 • Get the share of Deposits to Total: 12,636,617/30,949,407 = 40% • Get the share of Borrowings to Total: 18,312,790/30,949,407 = 60%
Case 3: Deposits & Borrowings… Interest Expense on Deposits • Steps to get the cost of the deposit component of the Product loan portfolio: • A) Divide Branch Interest Expense for the month by Total Deposit Liabilities as of end of month. Given the sample data: • A = P49,759/12,636,617 = 0.00394
Case 3: Deposits & Borrowings… Interest Expense on Deposits • B) Multiply (A) by the MFU Loan Portfolio • B = (722,933)*0.00394 = 2,847 • C) Multiply (B) by the share of deposits (40%) • C = 2,847*0.40 = 1,139 • D) Divide (C) by the factor (1 - 2%) • D = 1,139/(1-0.02) = 1,162
Case 3: Deposits & Borrowings: Interest Expense on Deposits... • Given the sample data in a previous slide, the whole arithmetic operation can be summarized as follows: • (722,933*(P49,759/12,636,617)*40%)/(1-2%) =(722,933*0.00394*0.40)/1-.02) =1,162 • Thus, for our example, the interest expense on the deposit component is P1,162.
Case 3: Deposits & Borrowings: Interest Expense on Borrowings... • Steps to get the cost of borrowings as a component of the Product loan portfolio: • A) Divide Branch Interest Expense on borrowings for the month by Total Borrowings as of end of month. Given the sample data: • A = 160,000/18,312,790 = 0.00874
Case 3: Deposits & Borrowings: Interest Expense on Borrowings... • B) Multiply (A) by the MFU Loan Portfolio • B = (722,933)*0.00874 = 6,316 • C) Multiply (B) by % borrowings (60%) • C = 6,316*0.60 = 3,790 • Hence, for our example, the interest expense on the borrowing component of the product loan portfolio is P3,790.
POST SCRIPT • The Monthly Monitoring Report Form can be accomplished using the form in Excel which is already automated. • Doing the Report manually initially as an exercise will help you understand better the procedures for accomplishing the Product income and expense statement.