Download
1 / 19
190 likes | 411 Vues
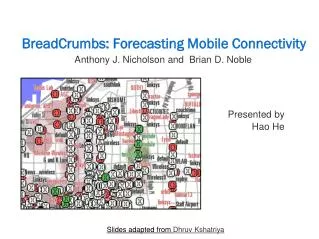
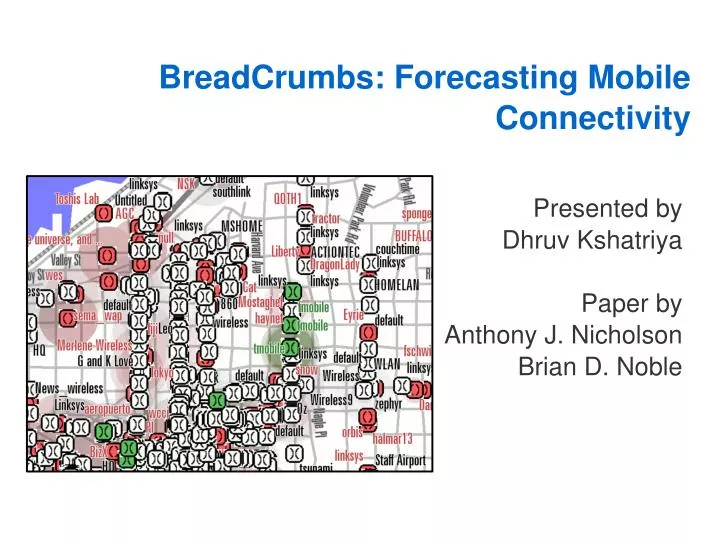
Presented by Dhruv Kshatriya Paper by Anthony J. Nicholson Brian D. Noble. BreadCrumbs: Forecasting Mobile Connectivity. Mobility complicates things. Often optimize for local conditions Laptop user stationary at a café Mobile scenario less stable

E N D
Presented by Dhruv Kshatriya Paper by Anthony J. Nicholson Brian D. Noble BreadCrumbs: Forecasting Mobile Connectivity
Mobility complicates things Often optimize for local conditions • Laptop user stationary at a café Mobile scenario less stable • Network quality and availability in flux • Multiple networks, multiple administrators • Handheld devices, always-on links • Want to use connectivity opportunistically Volatile quality and availability is a fact of life
The derivative of connectivity Access points come and go as users move Not all network connections created equal Limited time to exploit a given connection Consider trends over time, not spot conditions
The big idea(s) in this talk 1. Maintain a personalized mobility model on the user's device to predict future associations 2. Combine prediction with AP quality database to produce connectivity forecasts 3. Applications use these forecasts to take domain-specific actions
Contributions Introduce the concept of connectivity forecasts • Show how such forecasts can be accurate for • everyday situations w/o GPS or centralization • Illustrate through example applications
Observations Humans are creatures of habit • Common movement patterns Leverage AP selection work • Map AP distribution and quality
Improved Access Point Selection Conventionally AP’s with the highest signal strength are chosen. Probe application-level quality of access points • Bandwidth, latency, open ports • AP quality database guides future selection Real-world evaluation • Significant improvement over link-layer metrics
Determining location • Best: GPS on device • Unreasonable assumption? • PlaceLab • Triangulate 802.11 beacons • Wardriving databases • Other options • Accelerometer, GSM beacons
Mobility model • Second-order Markov chain • Reasonable space and time overhead (mobile device) • Literature shows as effective as fancier methods • State: current GPS coord + last GPS coord • Coords rounded to one-thousandth of degree(110m x 80m box)
BreadCrumbs User-level daemon, periodically: • Scan for APs • Estimate GPS location from 802.11 beacons • Test APs not seen before • Write test results to AP quality database • Update mobility model • Accepts application requests for Conn forecast • Convert from sec to no of state transitions
Connectivity forecasts Applications and kernel query BreadCrumbs Expected bandwidth (or latency, or...) in the future Recursively walk tree based on transition frequency
0.17 0.22 0.61 Forecast example: downstream BW What will the available downstream bandwidthbe in 10 seconds (next step)? 0.61*72.13 + 0.17*0.00 + 0.22*141.84 = 75.20 KB/s current 72.13 0.00 141.84
Evaluation methodology • Tracked weekday movements for two weeks • Linux 2.6 on iPAQ + WiFi • Mixture of walking, driving, and bus • Primarily travel to/from office, but some noise • Driving around for errands • Walk to farmers' market, et cetera • Week one as training set, week two for eval
Summary Humans (and their devices) are creatures of habit Derivative of connectivity, not spot conditions Mobility model + AP quality DB = connectivity forecasts Minimal application modifications yield benefits to user