Download

1 / 31
310 likes | 418 Vues
Explain why it is difficult to measure Scale Economies ?. Group Members. Group E1: Members: Lau Wai Kei, Patrick 02438750G Yee Chun Fank, Ben 00433665G Wong Yun Wah, Wallace 02409600G Chan Tak Kuen, Benedick 02716359G.

E N D
Group Members Group E1: Members: • Lau Wai Kei, Patrick 02438750G • Yee Chun Fank, Ben 00433665G • Wong Yun Wah, Wallace 02409600G • Chan Tak Kuen, Benedick 02716359G
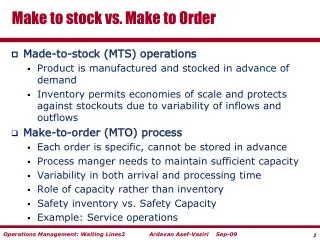
Presentation Outline • What is Economies of Scale • What is Diseconomies of Scale • Factors affecting Economies of Scale • Factors affecting Diseconomies of Scale • Three Approaches for Estimation of LRAC • Limitation for the 3 Approaches • Case Illustration • Conclusions
Economics of Scale • reductions in cost which arise from the utilization of larger sets of plant and equipment Davies and Lam (2001) • anything which serves to lower average costs in the long-run as scale of output increases. • Production process which raise productivity as scale ↑
Long Run Cost Function Scale of Long Run Long Run Long Run Long Run Production Total Product Total Cost Marginal Cost Average Cost (Capacity Level) (Output/Mo.) (LRTC) (LRMC) (LRAC) $5.00 A10,000 $50,000 $5.00 $4.00 B 20,000 $90,000 $4.50 $3.00 C 30,000 $120,000 $4.00 $3.00 D 40,000 $150,000 $3.75 $5.00 E 50,000 $200,000 $4.00 $6.00 F 60.000 $260,000 $4.33
$ * Lowest point of each SRAC SRAC-A SRAC-F a SRAC-C SRAC-B SRAC-E * SRAC-D b * p e * c * f * d r 10 20 30 40 50 60 Quantity (’000) The Long Run Cost Curve (LRAC)
$ Discrete Case a b e c f d The Long Run Cost Curve (LRAC) Quantity (’000)
$ Continuous Case Quantity The Long Run Cost Curve (LRAC)
$ LRAC Minimum LRAC Quantity The Long Run Cost Curve (LRAC) Least Cost Output
$ LRAC Economies of Scale Diseconomies of Scale Quantity Least Cost Output The Long Run Cost Curve (LRAC)
Factor Affecting Economies of Scale • specalization in the use of labor & capital • indivisible nature of many types of capital equipment • productive capacity of capital equipment rises faster than purchase price • stochastic economies in maintaining inventory of replacement parts and maintenance personnel • discounts from bulk purchases • lower cost of raising capital funds
Factor Affecting Economies of Scale … • spreading of promotional & research and development costs • management efficiencies (line & staff)
Factor Affecting Diseconomies of Scale • disproportionate rise in transportation costs • input market imperfections (e.g. wages rates driven up) • management coordination & control problems • disproportionate rise in staff & indirect labor
a. U-shape LRAC b. Declining LRAC c. Constant LRAC $ $ $ LRAC Minimal efficient scale (MEC) LRAC LRAC Quantity Quantity Quantity A Three Possible Long-Run Average Cost Curves for a Multi-plant Firm
b. Declining LRAC c. Constant LRAC a. U-shape LRAC $ $ $ LRAC Minimal efficient scale (MEC) LRAC LRAC Quantity Quantity Quantity A Economies of scale never exhausted > “A” – Diseconomies of scale Three Possible Long-Run Average Cost Curves for a Multi-plant Firm … >“MEC” – no Economies of scale
Three estimation on LRAC • Statistical Estimation of Scale Economies • The Engineering Approach • The Survivor Technique
Statistical cost analysis Approach • collect data on size & cost, or on input & outputs and fit a production or cost function. • e.g. Q=AKaLb • data need to compute the coefficient • a+b >1 → economies of scale • a+b < 1→ diseconomies of scale • In case of using the cost function, data of costs of producing the same product in the firm are collected.
Statistical cost analysis Drawbacks • difficult to gain sufficient data on inputs and outputs. • accounting concept on “Cost” vs “Opportunity Cost” • data derived from observation may only reflected SR cost curves, but not LR cost curves. • X-inefficient • Degree of capacity utilization
$ LRAC SAC1 A AC1 B C AC2 Q1 Q2 Quantity Problems in estimating the long-run costcurve
Statistical cost analysis Drawbacks (Con’d) … • different firms have set up their existing capacity at different time at different prices. • owing to imperfect information, fluctuation of factor prices ↓the usefulness of this approach. • in reality, we can’t observe firm operating in the portion of diseconomies of scale.
Engineering cost analysis Approach • using a knowledge of production technology • estimating cost functions only • to determine thelowest cost combinationof labor, capital equipment, and raw materials required to produce various levels of output.
$ Minimal efficient scale LAC Quantity Engineering cost analysis Drawbacks • accounting concepts of “costs” vs “Opportunity Cost” • ignore the cost of distribution, administration and management.
Engineering cost analysis Drawbacks (Con’d) … • expensive in practice to calculate cost for a number of different output levels in order to draw a smooth curve. • It may neglect certain aspects of labor or management organization that would alter efficiency.
Survivor Technique analysis Approach • Estimating cost functions • firms are classified by size within an industry • the shares of industry output coming from each size class over time are calculated. • size-classes whose shares of industry output are increasing (decreasing) over-time are presumed to be relatively efficient (inefficient) and have lower (higher) average costs.
LRAC This size category of firms lost market share This size category of firms lost market share These size categories gained market share Q1 Quantity The findings of the survivor technique $
Survivor Technique analysis Drawback • Too many assumptions • operating at similar environment, factor price and technology unchanged, market force must work effectively. • It fails to measure the amount of size of economics and therefore it cannot answer the question about the height of the entry barriers and the benefits of industrial concentration. • Only provide the optimum quantity of shipment and do not provide any further information on the shape of the long run average cost function.
Case Illustration • A large number of geographically dispersed plants in each category • Sufficient observations to avoid distortions of averages based on local demand differences, management errors, windfalls and technical innovations • An industry’s products and raw materials are defined narrowly over long periods of time • Cost data should be relatively free of distortions due to variations in product mix, model volume, and quality • Data Source: The Census of Manufactures, US
Fluid Milk (SIC 2026) • Criterion 1 – Large Numbers • Fluid milk industry contains several hundred plants across a wide range of sizes, as measured by employment • Criterion 2 – Narrowly Defined Products • The industry coverage and specialization ratios are relatively high in this industry, indicating few multi-product plants • Quality has remained stable over the years • Criterion 3 – Uniform Product Prices • Small and large plants operate in geographic proximity to one another • Prices are similar across the country • Criterion 4 – Uniform Input Prices • Raw materials for the industry generally are produced nationwide and are purchased largely on the open market
Cost and Quantity Computations • Cost per establishment (ALMC) • Is an approximation of average variable cost to determine the degree of size economies • Calculation: • Value of shipments (VS) is dived by wholesale price (P) to find the average quantity of output per size category: • Q = VS/P • The sum of total payroll (L) plus cost of materials (MC) is divided by the quantity of output (Q) to find the average labor plus materials • Then • Cost of establishment: ALMC = (L+MC)/Q
Minimum Efficiency Scale for Milk Industry by Survivor Approach • The minimum efficiency scale suggested by US Census data for milk industry is to employ 100 - 249 employees.