Download
1 / 35
380 likes | 532 Vues
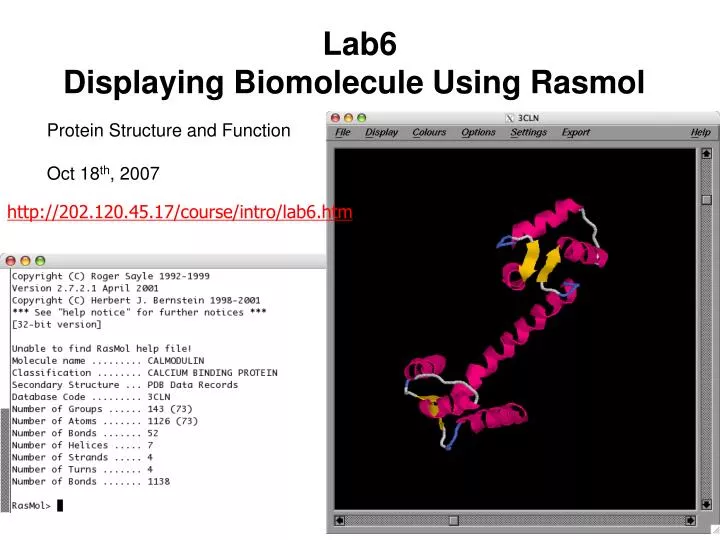
Lab6 Displaying Biomolecule Using Rasmol. Protein Structure and Function Oct 18 th , 2007. http://202.120.45.17/course/intro/lab6.htm. Protein visualization.

E N D
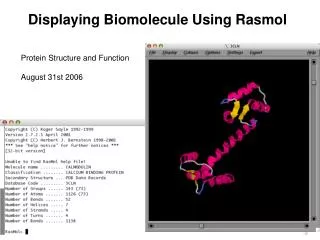
Lab6 Displaying Biomolecule Using Rasmol Protein Structure and Function Oct 18th, 2007 http://202.120.45.17/course/intro/lab6.htm
Protein visualization • The structure allows better understanding of the structure-function relationship, and is an important starting point for many kinds of research. • Tools - PC tools: rasmol, pymol, SwissPDBviewer (very powerful and contains many functions, i.e., homology modeling) - Web-based tools: Protein Explore
Protein Data Bank http://www.rcsb.org Search Field calmodulin
Rasmol http://www.openrasmol.org Protein Data Bank http://www.rcsb.org Protein PDB ID CD2 1hng Lysozyme 1lz1 GFP 1b9c ROP 1f4n -Lactalbum 1hml Calmodulin (apo) 1cfc Calmodulin (Ca2+) 3cln
The Select Command • Primitive expressions • Predefined sets • Comparison operators • Within expressions • logical combination of all above mentioned.
The select command • Atom number - select AtomNo.=102 • Residue – select Val52 (select resno=52) • Chain id – select :a • List of residue numbers – select 14,92, 46 • Range of atom numbers – select atomno=>35 • A wildcard can be used to specify a whole field: -- * Any number of characters Atom or residue type – select *.sg (this will select all Sulphur atoms in Cistein’s side chain) -- ? Single character wildcard – select ser70.c? – will select all carbons in all serine residues.
The within expressions defines the neighbors of a given set of atoms: select within (4.0, backbone) Distance: the cut-off in Å Where containing decimal point Set of atoms Example : all atoms not further than 3.5Å from Ala35: Select within (3.5, Ala35)
The predefined sets are groups of atoms given the definite names: select helix select hoh (water molecules) select protein There is a list with the predefined sets In order to display only what we selected, use the command: restrict selected
Boolean Expressions • select tyr and :a → all tyr in ‘a’ chain • select tyr or :a → all tyr in the molecule and all ‘A’chain • select not (try,:a) → all the molecule beside try and ‘a’ chain
Movement in Rasmol Rotation Horizontal Movement Vertical Movement Change Viewing Size
Movement in Rasmol Left Click Rotation Right Click Shift Key + Left Click Horizontal Movement Vertical Movement Change Viewing Size
To select a residue (# 78) select 78 To select an atom (atom# 122) select atomno=122 To change color of display color blue To change the background color background white To select one of the option from list select acidic
Exercise • Load the 1GCD.pdb (file → open) • Go over the display menu and try all of the options • Set the display on wireframe and try the color menu • Set the display on cartons and try the color menu again • Than, try the command line: • ribbons • wireframe 40 • spacefill 120 • spacefill off • select Ser • spacefill 150 • color cpk • zoom 200
select all wireframe 40 (If it doesn't work, do Display => wireframe in the menu) color chain hbonds on (how much Hbonds are their?) hbonds 30 color hbonds green hbonds off select hetero and not hoh spacefill 120 color CPK (Touch the selected atoms with the mouse and look on the command line) select water spacefill 120 color magenta select ligand spacefill 300
Question • Which atoms are present besides the protein? Show only them. • Show only the ligand (inhibitor) and the oxyanion pocket (gly193,ser195) • Color them in CPK. Display the inhibitor in sticks and the protein’s oxyanion pocket in balls and sticks. • Label the residues and the inhibitor (not every atom, just the number and type) • Measure the distance between the gly’s nitrogen and the ligand’s oxygen • Select all the protein. How many secondary structures does the protein contains? • Show only the helixes, center them on the screen. • select the resides that are within the radius of 8.0 Å from the inhibitor. Display only them and the inhibitor. Color the hydrophobic residues in blue and charged residues in magenta. What do you see?
select asp102,his57,ser195 or ligand restrict selected center selected color CPK Display => balls and sticks (on the menu) labels on labels off (try also the option menu- labels, what is the difference?) Select ligand Display sticks set picking distance (pick a pair of atoms which you want to know their distance) set picking distance off