Download
1 / 25
270 likes | 413 Vues
Bob delMas, Joan Garfield, and Andy Zieffler University of Minnesota. Sample an AIMS activity: What Makes the Standard Deviation Larger or Smaller (NSF DUE-0535912). Overview of Webinar. Goals of AIMS Materials developed Variability: Why is it important to understand?

E N D
Bob delMas, Joan Garfield, and Andy Zieffler University of Minnesota Sample an AIMS activity: What Makes the Standard Deviation Larger or Smaller(NSF DUE-0535912)
Overview of Webinar • Goals of AIMS • Materials developed • Variability: Why is it important to understand? • Learning sequence for understanding variability • An example activity: What Makes the Standard Deviation Larger or Smaller?
Goals of AIMS • Integrate and adapt innovative materials developed for introductory statistics • Develop lesson plans and activities for important topics • Focus on developing statistical literacy and reasoning (see GAISE; http://www.amstat.org/education/gaise/) • Build materials on important instructional design principles
Materials Developed • AIMS website (http://www.tc.umn.edu/~aims/) • Lesson plans (28) • 1 to 3 Activities for each lesson • Suggested sequences of activities • Compilation of research: Developing Students' Statistical Reasoning: Connecting Research and Teaching Practice by Joan Garfield and Dani Ben-Zvi
The Importance of Variability Variability is…the essence of statistics as a discipline and it is not best understood by lecture. It must be experienced (Cobb, 1992) Understanding Variability is • Key component of understanding distribution • Core component of statistical thinking • Essential for making statistical inferences (Garfield & Ben-Zvi, 2008)
What is Variability? • Recognize that values can vary or change • A measure of spread tied to ideas of • Center • Distribution • Different sources of variability: • Natural variation • Measurement error • Sampling
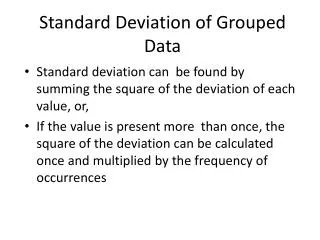
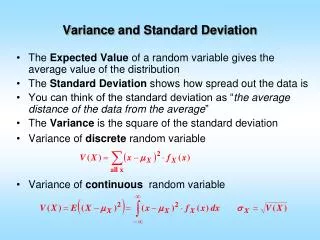
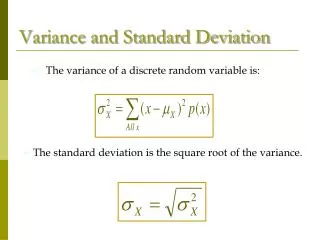
What is the Standard Deviation? • As a concept, tied to the idea of center • A measure of the extent to which values deviate from center • Standard deviation as average distance from center • Coordination of ideas of deviation from the mean (distance) and density (frequency)
Building an Understanding of Variability Informal Ideas of Variability (Garfield & Ben-Zvi, 2008) • Data vary • Results from random processes • Examine and compare graphs to develop ideas about spread in distributions • Range as a simple measure of spread
Building an Understanding of Variability Formal Ideas of Variability (Garfield & Ben-Zvi, 2008) • Two types: Diversity and Measurement Error • Comparisons: A lot and a little variability • Standard deviation as average deviation from the mean • Factors that effect the the standard deviation • Representing center and spread in graphs
What Makes the SD Larger or Smaller? Activity Goals • Informally estimate “typical” deviation from the mean. • Understand standard deviation as a measure of spread. • Understand what makes standard deviations larger or smaller • Identify distribution with larger standard deviation by comparing graphs.
Activity to Build Prior Knowledge Post-It Note Dot Plots Activity • Number line that represents ages of students • Arrange Post-It notes to meet criteria: • Mean age = 21 by placing all notes at 21 • Move one note to 24. Move 2nd so mean = 21 • Move one note to 17 and others so mean = 21 • Compute deviations from the mean • Use change in deviations for note placement
Standard Deviation Activity Learn method to determine "average deviation from the mean" Draw in each deviation from the mean. Estimate the length of the average deviation. Draw a line of this length below the graph.
Standard Deviation Activity Learn method to determine "average deviation from the mean" Draw in each deviation from the mean. Estimate the length of the average deviation. Draw a line of this length below the graph.
Activity: Comparing Standard Deviations Below, you will find five pairs of graphs. The mean for each graph (m) is given just above each histogram. For each pair of graphs presented, • Indicate which one of the graphs has a larger standard deviation or if the two graphs have the same standard deviation. • Explain why. (Hint: Try to identify the characteristics of the graphs that make the standard deviation larger or smaller.)
Comparing Standard Deviations • Both graphs have the same range • Relatively few deviations of -2 or 2 in Graph A • Majority of deviations are 2 or -2 in Graph B
Comparing Standard Deviations • One graph is the mirror image of the other • Frequencies of each mean deviation the same • Therefore, average deviation the same
Comparing Standard Deviations • All deviations in Graph B are -2.5 or 2.5 • 1/3 deviations in Graph A are -2.5 or 2.5 • Therefore, average deviation larger for Graph B
Understanding of Standard Deviation Guide whole-class discussion of explanations: • Larger Range is not necessarily Larger SD • Same Range is not necessarily equal SD • Larger number of possible values ≠ Larger SD • Evenly spread out ≠ Larger SD • Majority of deviations close to mean = Smaller SD • Majority of deviations far from mean = Larger SD
Further Development of Understanding Building on Formal Ideas of Variability • Factors that affect range and IQR • Use center and spread to compare groups • Roles of variability within and between groups when comparing groups • Relationship between sampling variation and sample size • Variability in bivariate plots
AIMS Resources • AIMS website (http://www.tc.umn.edu/~aims/) • Lesson and lesson plans • Sequence of ideas about variability • Technology tools used • Link to the new book by Garfield and Ben-Zvi (provides research foundations for lessons)
REFERENCES Cobb, G. (1992), Teaching statistics. In L. Steen (Ed.), Heeding the call for change: Suggestions for curricular action, MAA Notes, Vol. 22, 3-33. Garfield, J. & Ben-Zvi, D. (2008). Developing Students' Statistical Reasoning: Connecting Research and Teaching Practice. Springer.
Thank You! • Please check out and use our materials. AIMS website (http://www.tc.umn.edu/~aims/) • Please send us your feedback. Joan Garfield: jbg@umn.edu Bob delMas: delma001@umn.edu Andy Zieffler: zief0002@umn.edu