Download
1 / 36
360 likes | 552 Vues
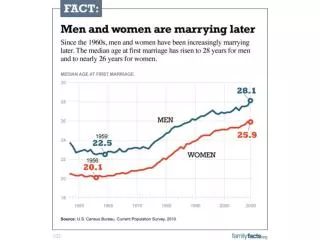
Representing Uncertainty on Charts: The “Hydrographic Crisis”. Uncertainty Workshop CHC 2004. The Gordon Reid. The Canadian Coast Guard Ship (CCGS) Gordon Reid ran aground on an uncharted rock in Estavan Sound, off the coast of British Columbia on 28 September 2003

E N D
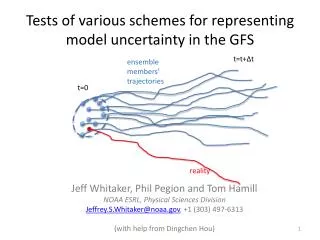
Representing Uncertainty on Charts: The “Hydrographic Crisis” Uncertainty Workshop CHC 2004
The Gordon Reid • The Canadian Coast Guard Ship (CCGS) Gordon Reid ran aground on an uncharted rock in Estavan Sound, off the coast of British Columbia on 28 September 2003 • CHS Chart 3724: 1923 lead-line and sextant survey with 400 metres between sounding lines
Research Undertaken • Topic of the UNB Uncertainty Paper, “Bathymetric Uncertainty Representation on Nautical Charts” • Research taken on by UNB & USM graduate students under the direction of Dr. Dave Wells
The Uncertainty Situation • Many users of nautical charts have no idea how uncertain is the information shown on the charts they are using • This leads to inappropriate navigation decisions, groundings, and sometimes loss of life
Uncertainty in Hazard Detection • Bathymetric Uncertainties • Positioning Uncertainties • Incomplete coverage between survey lines (as was the fate of the Gordon Reid)
Navigation Decisions • Mariners have excellent positioning tools due to high accuracy GPS and ENCs • This does not account for positioning uncertainty present at time of survey • For example, over half of the inshore NOAA nautical charts were acquired by lead-line and sextant surveying prior to 1940
3 Methods of Representing Uncertainty • Two methods, a Source Diagram (SD), and a Reliability Diagram (RD) are graphical insets on a paper chart • Showing the geographical limits for each survey • A table describing the attributes of each survey area in the diagram • Zone of Confidence (ZOC) methods used on Electronic Navigational Charts (ENC)
Source Diagrams (SCD) • Hydrographic organization • Date of survey • Scale of survey • Direct line spacing information
Model Source Diagram IHB M4
NOS SD NOAA Approach (A) 1990 to the present. Full bottom coverage. DGPS positioning used. (B1) 1990 to the present. Partial bottom coverage from single beam echo sounder. GPS or DGPS used. (B2) 1970 to 1989. Partial bottom coverage from single beam echo sounder. Primarily electronic radio-positioning . (B3) 1940 to 1969. Partial bottom coverage from single beam echo sounder. Visual positioning (B4) 1900 to 1939. Partial bottom coverage from lead line. visual positioning. (B5) Pre-1900. Partial bottom coverage from lead line. visual positioning.
Reliability Diagrams • Give an assessment of accuracy as well as advising on preferred areas for navigation • Examples of the attributes • Estimated accuracy of soundings • Distance between survey sounding lines • Classification of the survey (e.g. reconnaissance or incomplete; controlled; sounded by lead line; sounded by echosounder; shoals have been examined; has been sonar swept)
Model Reliability Diagram IHB M4
Zones of Confidence (ZOC) • ZOC values assigned to areas on an ENC • A1/A2: Full bottom ensonification with depths determined for all significant features • B: Uncharted hazards may exist • C: Uncharted depth anomalies are expected • D: Large depth anomalies are expected
3 Active Directions • Education for users • Worldwide HO Survey • Presentation on charts
Canadian Power & Sail Squadrons • Teaches courses to recreational boaters nationwide • General, advanced, and specialty boating
Status of Uncertainty Representation Education • No education currently available in Canada • No education availablethrough the United StatesPower Squadrons (USPS)
Worldwide HO Survey • HOs from around the world have been contacted • 5 questions were asked about their uncertainty policies
Survey Questions • Asked 5 questions about their uncertainty information • Both paper and electronic charts • Methods of communication to users • Satisfaction with current policy • Plans to change current policies, and barriers which prevent doing so • Very diverse responses • Australia, Canada, Denmark, Finland, Greece, Hong Kong, Iceland, Italy, Japan, Mexico, Netherlands, New Zealand, Norway, Poland, Portugal, Saudi Arabia, South Africa, Sweden, Turkey, UK, US NGA, US NOAA
1: How is uncertainty represented on your paper charts? • Some agencies do not use SDs or RDs at all (one agency removed SDs from their charts, since they were not kept updated) • Some agencies use SDs only on large scale charts • Most agencies are in the process of adding SDs to their charts. One agency claimed 100% of their charts had SDs
2. Are ZOC values on your ENCs fully attributed? • 40% have full ZOC attribution on all ENCs (over half of these use only ZOC values B and C, or in one case only B on all ENCs) • 30% use only U attribution so far • 30% are partway to full attribution • Reasons for not having full ZOC attribution were lack of resources, lack of metadata upon which to base the ZOC, and the liability implied by assigning a ZOC
3. How else do you communicate information on chart uncertainties to users? • 60% use Notices to Mariners • 25% used web pages, other nautical publications, and presentations to user groups. • The Danish hydrographic office booklet “Behind the Nautical Chart” is free for downloading from its website. This booklet explains the uncertainty associated with hydrographic survey methods over the years (and is soon to be translated from Danish to English)
4. Are you satisfied with your current policies and practices? • 30% answered yes • 60% answered with a qualified or unqualified no • 10% dodged the question (e.g. “we will always try to improve”) • The qualified no answers were based on a desire for better methods than SDs, RDs or ZOCs, and on liability issues associated with RDs and ZOCs
5. Are you considering any changes to these policies and practices? • 15% answered no • 10% answered they would comply with any new international standards that might emerge • 40% intend to work towards completion of SDs on all paper charts, and / or full ZOC attribution on all ENCs • 35% seek improvements to their entire hydrographic data management strategy, uncertainty information
Defining the end user • Commercial Shipping • Fishing and Natural resources • Recreational users • Military/Coast Guard
Need based representation • Establish product enhancements based on input from user groups. • Common factor being improved situational awareness. • What enhancements will most improve the safety and decision making of the Navigator?
Why add the enhancement? • How and under what circumstances will it be used? • Voyage planning. • Weather maneuvering. • Shipboard medical emergency. • Result: Time critical decision making requires clear depiction of reliability.
What to add to the Chart? • Source diagram – Voyage and approach planning.
What to add to the Chart? • Primary chart depiction - Best for time critical decision making. Rocks, soundings and depth contours printed in red (Gulf of Finland)
UNB Recommendations • Survey details including: - Date of survey - Survey and positioning technology used - Line spacing/amount of coverage • Given by either exact survey details, or by a classification scheme to maximize clarity and simplicity
UNB Recommendations • Timeless, without the use of descriptive quality terms such as “modern standards” or “current technology” • Be accompanied by a form of education for chart users • Be part of a national standard, with the ultimate future goal of a global standard