Download
1 / 13
130 likes | 156 Vues
CHAPTER – 1.1 UNCERTAINTIES IN MEASUREMENTS. 1.1 MEASURING ERRORS Error / Uncertainity : the difference between an observed or calculated value and the true value. True Value: obtained from earlier experiments or from theoretical model predictions

E N D
CHAPTER – 1.1 UNCERTAINTIES IN MEASUREMENTS
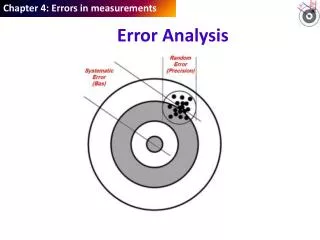
1.1 MEASURING ERRORS • Error /Uncertainity: the difference between an observed or calculated value and the true value. • True Value: obtained from earlier experiments or from theoretical model predictions • Error Analysis: estimation of error or uncertainties in the results • Types of Errors: Systematic errors • Random errors
EXAMPLE 1.1 • Top length measurements with a steel meter stick at room temperature of 20C . • a result : 1.982 ± 0.00l)m for the length of the table. • Systematic error: meter stick calibrated at 25°C with an expansion coefficient of 0.0005 °e-l. • Due to measurements were made at a room temperature of 20°C, they are systematically too small. • To correct for this effect, multiplies his results by 1 + 0.0005 X (20 - 25) = 0.9975 so that his new determination of the length is l.977 m. • When the student repeats the experiment, finds a second systematic error, of not reading the divisions from directly above. • He determines that this consistently resulted in a reading that was 2 mm short. • The corrected result is l.979 m.
the first result was given with a fairly high precision of approximately 1 part in 2000. • The corrections to this result did not improve the precision at all, but did in fact worsen it, because the corrections were themselves only estimates of the exact corrections. • Before quoting his final result, the student must re-examine his error • analysis and take account of any additional uncertainties that may have been introduced by these corrections
Random Errors • Random errors due to fluctuations in observations that yield different results each time the experiment is repeated. • A given accuracy implies precision and, therefore, also depends on random errors. • Reduction in random errors is simply by repeating the experiment. • random errors result from instrumental uncertainties, they may be reduced by using more reliable and more precise measuring instruments. • If the random errors result from statistical fluctuations in a limited number of measurements, they may be reduced by making more measurements. • Limitation in improvements. • In the measurement of the length of the table the student might attempt to improve the precision of his measurements by using a magnifying glass to read the scale, or he might attempt to reduce statistical fluctuations in his measurements by repeating the measurement several times. • In neither case would it be useful to reduce the random errors much below the systematic errors, such as those introduced by the calibration of the meter stick or the correction for his initial faulty reading of the scale. • The limits imposed by systematic errors are important considerations in planning and performing experiments.
Significant Figures and Roundoff • precision of an experimental result given by by the number of digits in the recorded result • significant figures:: • 1. The leftmost nonzero digit is the most significant digit. • 2. If there is no decimal point, the rightmost nonzero digit is the least significant digit. • 3. If there is a decimal point, the rightmost digit is the least significant digit, even if it is a 0. • 4. All digits between the least and most significant digits are counted as significant digits.
Significant digits examples : • 1234, 123,400, 123.4, 1001, 1000., 10.10,0.0001010, 100.0. • If there is no decimal point, there are ambiguities when the rightmost digit is 0. • Thus, the number 1010 is considered to have only three significant digits even though the last digit might be physically significant. • To avoid ambiguity, it is better to supply decimal points or to write such numbers in scientific notation • Thus, 1010 would be written as 1010. or 1.010 X 10³if all four digits are significant.
1.2 UNCERTAINTIES • Uncertainties in experimental results have two categories: • those that result from fluctuations in measurements, • and those associated with the theoretical description of our result. • In a measurement of the length of one edge of a rectangular table, we uncertainties may arise from systematic errors, and due to the fluctuations of our measurements from trial to trial. • With an infinite number of measurements we might be able to estimate the length very precisely, but with a finite number of trials there will be a finite uncertainty. • In the measurement of the length of the table at equally spaced positions across the table, additional fluctuations corresponding to irregularities in the table itself, and our result could be expressed as the mean length. • If, however, we were to describe the shape of an oval table, uncertainties both in the measurement of position of the edge of the table at various points and in the form of the equation to be used to describe the shape, whether it be circular, elliptical, or whatever. • concerned with a comparison of the distribution of measured data points with the distribution predicted on the basis of a theoretical model. • This comparison will help to indicate whether our method of extracting the results is valid or needs modification.
error means difference of the result from some "true" value. • Since true value is unknown , one can only estimate the errors inherent in the experiment. • discrepancy : • difference between the two repeated results of an experiment. • Discrepancy arises due to measurement made with a given uncertainty. • Difference between experimental result and the standard or accepted value • distribution of the results of repeated measurements of the same quantity can lead to an understanding of these errors . • that the quoted error is a measure of the spread of the distribution. • for some experiments it may not be feasible to repeat the measurements and experimenters must therefore attempt to estimate the errors in a single measurement . • if the student of Example 1.1 could make only a single measurement of the length of the table, he should examine his meter stick and the table, and try to estimate how well he could determine the length.
His estimate should be consistent with the result expected from a study of repeated measurements; • that is, to quote an estimate for the standard error, • he should try to estimate a range into which he would expect repeated measurements to fall about seven times out of ten. • Thus, he might conclude that with a fine steel meter stick and a well-defined table edge, he could measure to about ± 1 mm or ±0.001 m. • Minimizing Uncertainties and Best Results • we shall be interested in obtaining the maximum amount of useful information from the data on hand without repeating the experiment with better equipment or to reduce the statistical uncertainties by making more measurements. • the most reliable results from a given set of data will be those for which the estimated errors are the smallest. • Thus, our development of techniques of error analysis will help to determine the optimum estimates of parameters to describe the data.