Download

1 / 11
110 likes | 120 Vues
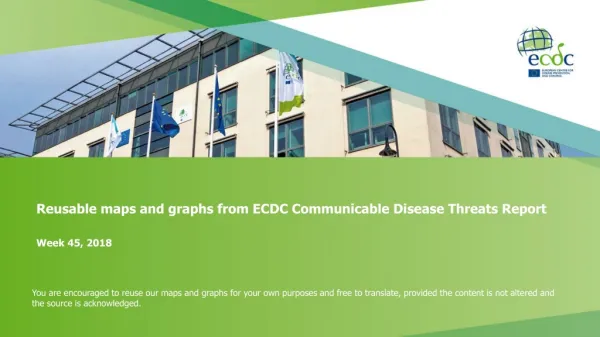
Reusable maps and graphs from ECDC Communicable Disease Threats Report Week 40, 2019. You are encouraged to reuse our maps and graphs for your own purposes and free to translate, provided the content is not altered and the source is acknowledged.

E N D
Reusable maps and graphs from ECDC Communicable Disease Threats ReportWeek 40, 2019 You are encouraged to reuse our maps and graphs for your own purposes and free to translate, provided the content is not altered and the source is acknowledged.
Distribution of confirmed and probable cases of Ebola virus disease by week of reporting, Democratic Republic of the Congo and Uganda, as of 2 October 2019
Ebola Virus Disease case distribution in DRC and Uganda as of 2 October2019
Geographical distribution of confirmed and probable cases of Ebola virus disease, Democratic Republic of the Congo and Uganda as of 2 October 2019
Distribution of confirmed cases of MERS-CoV by place of infection and month of onset, March 2012–30 September 2019
Geographical distribution of confirmed MERS-CoV cases by probable region of infection and exposure, April 2012–30 September 2019
Geographical distribution of confirmed MERS-CoV cases by country of infection and year, April 2012–30 September 2019
Geographical distribution of confirmed MERS-CoV cases by reporting country,April 2012–30 September 2019
Distribution of yellow fever cases, Nigeria 2019, week 27-38 in 2019