Download

1 / 23
250 likes | 367 Vues
The Application of Queueing Theory. Problem 26.4-3 & 17.7-8. Problem 26.4 -3.

E N D
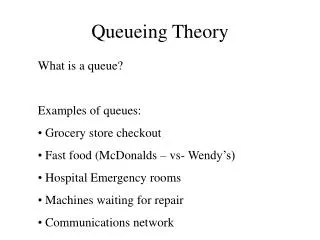
The Application of Queueing Theory Problem 26.4-3 & 17.7-8
Problem 26.4-3 • The Southern Railroad Company has been subcontracting for the painting of its railroad cars as needed. However, management has decided that the company can save money by doing this work itself. A decision now needs to be made to choose between two alternative ways of doing this.
Problem 26.4-3 (cont’d) • Alternative 1 is to provide two paint shops, where painting is done by hand (one car at a time in each shop), for a total hourly cost of $70. The painting time for a car would be exactly6 hours. • Alternative 2 is to provide one spray shop involving an hourly cost of $100. In this case, the painting time for a car (again done one at a time) would be exactly 3 hours. • For both alternatives, the cars arrive according to a Poisson process with a mean rate of 1 every 5 hours. The cost of idle time per car is $100 per hour.
Problem 26.4-3 (cont’d) • What queueing models would you use for alternative 1 and alternative 2?
Problem 26.4-3 (cont’d) • What queueing models would you use for alternative 1 and alternative 2?
Problem 26.4-3 (cont’d) • How would you calculate expected number of cars in the system and total cost for alternative 1 and alternative 2?
Problem 26.4-3 (cont’d) • How would you calculate expected number of cars in the system and total cost for alternative 1 and alternative 2?
Problem 26.4-3 (cont’d) • How would you calculate expected number of cars in the system and total cost for alternative 1 and alternative 2? • For alternative 1, it is a M/D/2 model. For the multiple-server of M/D/s model, a complicated method is available for deriving the steady-state probability of the number of customer in the system and its mean [assuming ρ<1]. These results have been tabulated for numerous cases, and the means (L) also are given graphically in Fig. 17.8
Problem 26.4-3 (cont’d) • How would you calculate expected number of cars in the system and total cost for alternative 1 and alternative 2?
Problem 26.4-3 (cont’d) • How would you calculate expected number of cars in the system and total cost for alternative 1 and alternative 2? • TC(Alternative 1) = $220 • TC(Alternative 2) = $205 • Alternative 2 should be chosen.
Problem 17.7-8 • The McAllister Company factory currently has two tool cribs, each with a single clerk, in its manufacturing area. One tool crib handles only the tools for the heavy machinery; the second one handles all other tools. However, for each crib the mechanics arrive to obtain tools at a mean rate of 18 per hour, and the expected service time is 3 minutes.
Problem 17.7-8 (cont’d) • Because of complaints that the mechanics coming to the tool crib have to wait too long, it has been proposed that the two tool cribs be combined so that either clerk can handle either kind of tool as the demand arises. It is believed that the mean arrival rate to the combined two-clerk tool crib would double to 36 per hour and that the expected service time would continue to be 3 minutes. However, information is not available on the form of the probability distributions for interarrival and service times, so it is not clear which queueing model would be most appropriate.
Problem 17.7-8 (cont’d) Compare the status quo and the proposal with respect to the total expected number of mechanics at the tool crib(s) and the expected waiting time (including service) for each mechanic. Consider queueing models: M/M/s, M/D/s, M/Ek=2/s, and D/M/s.
Problem 17.7-8(cont’d) • If use M/M/s model, we have
Problem 17.7-8(cont’d) • If use M/D/s model, we have
Problem 17.7-8(cont’d) • If use M/Ek/s model (use k=2), we have
Problem 17.7-8(cont’d) • If use D/M/s model, we have
Problem 17.7-8(cont’d) • To summarize