Download

1 / 21
210 likes | 321 Vues
Presenting your Results. A discussion on what went wrong, and how to do better next time. Report Feedback. Comments written in your report Oral feedback Marking form Tick boxes. It is your responsibility to take these comments on-board and improve. . The sections in your report.

E N D
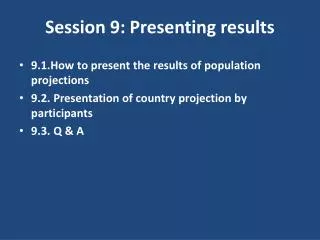
Presenting your Results A discussion on what went wrong, and how to do better next time...
Report Feedback • Comments written in your report • Oral feedback • Marking form • Tick boxes It is your responsibility to take these comments on-board and improve.
The sections in your report Marking Pro-Forma Abstract Introduction Theory Experimental details Results & discussion General discussion Summary & Conclusions References, overall layout
The marking form • Use the tick boxes as additional guides • Look to see how to improve your marks, they provide a clear indication of which areas you performed well in and vice-versa.
Common Issues • Template • PAGINATION • Critical analysis of results • STORY • Structure • Layout • Figure captions • Equation numbering • Tables • Content • What / Where
Structure • Structure • Layout • Figure captions • Equation numbering • Tables • Style • Fonts • Resolution
The Template http://www2.warwick.ac.uk/fac/sci/physics/teach/module_home/px110/
A note on references • References should be sequential • When referring to the same reference, use the same number – it can be used more than once! • Book references must have the publisher • Better to refer to a chapter/page • If making multiple references to a book • page 7 of ref 1, • this can be found in chapter 2 of [1] • Or include chapters in the actual reference • Web references need a date
A note on Equations • Equations can be inline (not numbered) or set-out explicitly and numbered • Equations should be punctuated • Define all variables • Format used for variables in the text should match the format used in the equations – i.e. italics
A note on Pagination • Everything must be within the page margins • Title and paragraph positions • Figures/tables + caption should be grouped as a single object • If you do not refer to a figure in the text, it may as well not be there • Justify the text
A note on figures • Different to those in lab-book. • No title as there is a figure caption • Never ‘a plot to show’ or ‘a graph showing’ in figure caption • Include the best-fit parameters in the caption AND the text, but NOT on the figure. Include intercepts!
A note on FONT size • Font sizes in figures should be same as in the figure caption – rescale insets
It’s a story • The story is what you want it to be • Not necessarily a description of all of an experimental session • Guide a reader through • Beginning • Middle • End
Abstract Flow Diagram Introduction Background, key theoretical ideas Methodology How it was done. Details of apparatus and uncertainties. Main results and analysis. Make sure it is NOT a list of figures. Comment on trends. Results How do your results confirm the introductory theory given their uncertainties? Improvements and further work. Summarise key points. Discussion/ Conclusion
Abstract • What / How / Results and maybe Why • Avoid waffle and keep the messages simple • Good English
2. Methodology • Generally too long in the 1st round of reports • 1 -2 paragraphs more than enough • Do NOT go into details of your agonising thought processes as to which was the best way to do the experiment • You do NOT get any marks for showing how hard you worked • FIGURES
Experimental Results • You may remind the reader of what it is you are trying to measure and show how this is to be accomplished • You should always give a concise description of how your results were deduced from your raw data • Make sure that you present your data in prose and that the figures are within the page boundaries
Presenting the results • Not a list of figures • Keep it clear • Present and EXPLAIN your ideas • Discuss the quality of the fits • Highlight any obvious discrepancies • There can be only one value – what is your best result and why
Discussion and Conclusions • Discuss the significance of your results when compared with the published results or accepted theories • How do the results shed light on the theory introduced earlier • What impact do the results have on future or other areas • Discuss only in terms of the numbers and their errors • Not interested in HUMAN ERROR or % errors • Use scientifically meaningful language • Discuss the sources of error, the problems encountered in your own investigation and their effect on the end result • Consider the advantages and disadvantages of the experimental method you have used
Conclusions • Note: • No mention of whether • ‘it met the aims’ • ‘worked well’ • ‘got the right answer’ • Similar in style to the abstract
Abstract Flow Diagram Introduction Methodology Results Discussion/ Conclusion