Download
1 / 2
20 likes | 107 Vues
Zuo -Supplementary Figure 1 (page 1 of 2). A. B. C. D. E. F. G. H. Continue- Zuo -Supplementary Figure 1. -. -. -. -. -. -. -. -. -. +. +. +. -. -. -. +. +. +. +. +. +. -. -. -. -. -. -. I.

E N D
Zuo-Supplementary Figure 1 (page 1 of 2) A B C D E F G H
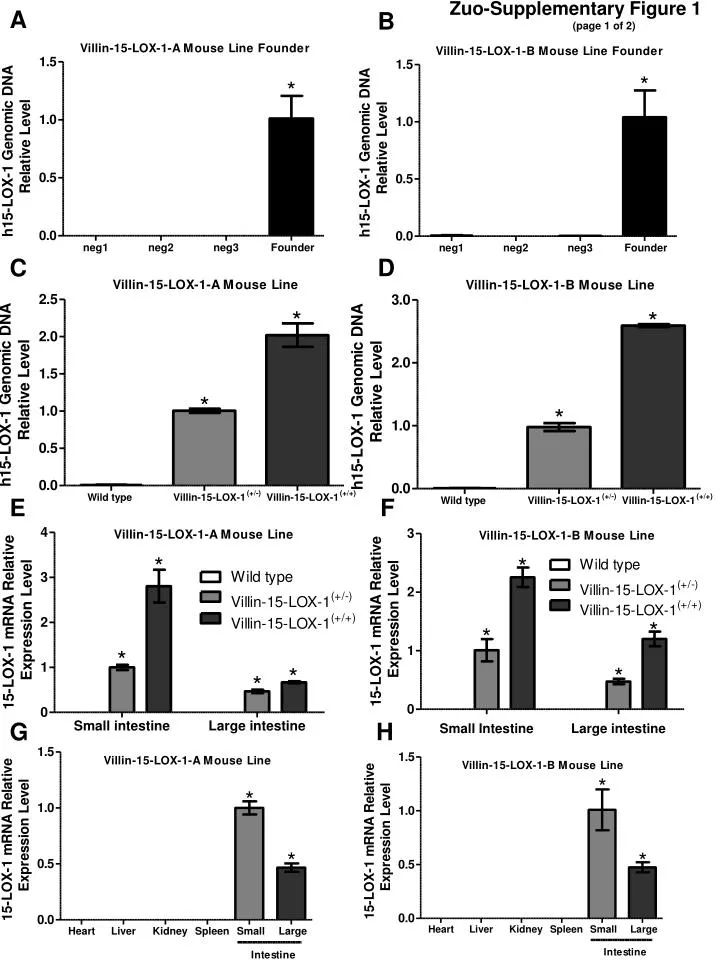
Continue-Zuo-Supplementary Figure 1 - - - - - - - - - + + + - - - + + + + + + - - - - - - I Villin 15-LOX-1-A Mouse Line J Villin 15-LOX-1-B Mouse Line Large intestine Small intestine Liver - - - - - - + + + Villin-15-LOX-1 +/+ - - - - - - + + + Villin-15-LOX-1 +/- - - - - - - + + + Positive control Positive control Positive control Wild type 15-LOX-1 Actin Supplementary Figure 1. Generation of villin-15-LOX-1 mice. (A and B) Villin-15-LOX-1 mouse genotyping. Quantitative real time polymerase chain reaction (qPCR) analysis of genomic human 15-LOX-1 (h15-LOX-1) in littermates generated by pronuclear injections of the villin-15-LOX-1 construct into fertilized C57BL/6 (villin-15-LOX-1-A) and FVB/N (villin-15-LOX-1-B) mouse oocytes. The levels of genomic h15-LOX-1 were calculated relative to the level of a calibrator sample (founder). Values are means and 95% confidence intervals (CIs) for four (A) or three (B) replicate measurements. *P < .001, two-sided ANOVA for founders vs negative mice. C and D) Identification of heterozygotes and homozygotes among villin-15-LOX-1 mouse lines. Founders for villin-15-LOX-1-A and villin-15-LOX-1-B mouse lines were bred with wild type (WT) mice from the same genetic background. Genomic qPCR analysis of h15-LOX-1 was performed in littermates for each cell line. The levels of genomic h15-LOX-1 were calculated relative to the level of a calibrator sample (heterozygotes: villin-15-LOX-1(+/-)). Values are means with 95% CIs for four replicate measurements. *P < .001 (two-sided ANOVA) for all comparisons (WT vs villin-15-LOX-1(+/-), WT vs villin-15-LOX-1(+/+), villin-15-LOX-1(+/-) vs villin-15-LOX-1(+/+)). E-J) Targeted intestinal 15-LOX-1 expression in villin-15-LOX-1 mice. E and F) qRT-PCR analysis of15-LOX-1 mRNA expression in small and large intestinal crypts of villin-15-LOX-1-A and villin-15-LOX-1-B heterozygotes and homozygotes and WT mice. Values are means with 95% CIs for triplicate experiments. *P < .001 (two-sided ANOVA) for all comparisons (WT vs villin-15-LOX-1(+/-), WT vs villin-15-LOX-1(+/+), villin-15-LOX-1(+/-) vs villin-15-LOX-1(+/+)). G and H) qRT-PCR analysis of 15-LOX-1 mRNA expression in isolated intestinal crypts from small and large intestine and various organs from a villin-15-LOX-1-A and villin-15-LOX-1-B mice. Values are means with 95% CIs for triplicate experiments. *P < .001 (two-sided ANOVA) for intestine (large or small) vs other organs. I and J) 15-LOX-1 protein expression from intestinal crypts and liver of villin-15-LOX-1-A (I) and villin-15-LOX-1-B (J) mice. Positive control was HCT-116 cells transfected with a 15-LOX-1 expression vector. Large intestine Small intestine Liver Villin-15-LOX-1 +/+ Villin-15-LOX-1 +/- Positive control Positive control Positive control Wild type 15-LOX-1 Actin