Download
1 / 2
20 likes | 107 Vues
Supplementary Figure 1. 3. 2,5. 2. 1,5. 1. 0,5. 0. 6. 5. 4. 3. 2. 1. 0. A. WT with FSK+Gen. WT with FSK. lF508del with FSK+Gen. lF508del with FSK. ns. ns. ns. ns. Bicarbonate secretion ( normalized to the rate in FSK-treated F508del as 1). 10 min post peak response.

E N D
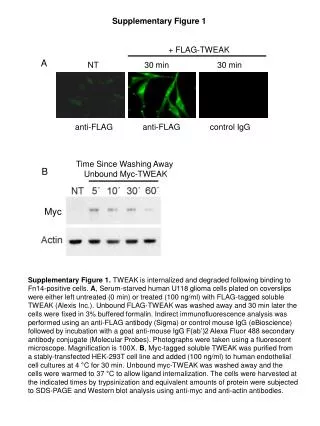
Supplementary Figure 1 3 2,5 2 1,5 1 0,5 0 6 5 4 3 2 1 0 A WT with FSK+Gen WT with FSK lF508del with FSK+Gen lF508del with FSK ns ns ns ns Bicarbonate secretion (normalized to the rate in FSK-treatedF508del as 1) 10 min post peak response Peak response WT with FSK+Gen WT with FSK lF508del with FSK+Gen lF508del with FSK B ns * ΔIsc (normalizedto the F508del FSK-induced peak as 1) ns ns Peak response 10 min. post peak response Supplementary Figure 1: ∆JHCO3- and ∆Isc in F508del or WT duodenal mucosa in response to either FSK or FSK plus genistein Duodeni of F508del or WT littermates were placed in Ussing chambers in a paired fashion, and stimulated either with FSK, or with a combination of 10µM FSK and 10µM genistein bilaterally. For comparison, FSK-alone induced ∆JHCO3- (A) or ∆Isc (B) in in the F508del mucosa was set to 1, and the response of each of the other tissues is shown in relation to the response seen in FSK-only in F508del mucosa. While the addition of genistein slightly increased the secretory response in F508del mucosa, the same was seen in WT mucosa, and did not reach statistical significance. The only significant difference was that the combination of FSK and genistein resulted in a signifcantly higher plateau value (10 min after peak). n=5, p<0.05 .
Supplementary Figure 2 * ns 6 2 * ns ns 5 ns 4 * Basal JHCO3-, µmol·cm-2·h-1 3 1 ⊿JHCO3-, µmol·cm-2·h-1 ns 2 1 0 0 Mid-colon Duodenum Mid-colon Duodenum WT WT+S1611 WT+S1611+CFTR inhibitors 12 * 10 8 6 ⊿Isc, µEq·cm-2 4 2 0 Mid-colon Duodenum C B A Supplementary Figure 2: Effect of S1611 and CFTR inhibitors on FSK-induced ∆JHCO3- and ∆Isc in WT duodenal and colonic mucosa Compared to nontreated controls, 20µM S1611 (NHE3 inhibition) reduced FSK-induced ∆JHCO3- (B) but not the FSK-induced ∆Isc (C) in WT duodenal mucosa, consistent with the role of NHE3 as a transporter that acidifies the lumen and is inhibited by intracellular cAMP. In mid colonic mucosa, 20µM S1611 reduced FSK-induced ∆JHCO3- (B), but for unknown reasons, it also reduced ∆Isc (C), possibly because the decrease in pHi secondary to colonic NHE3 inhibition interferes with K+ channels, therely reducing membrane potential and therefore driving force for CFTR-dependent anion exit. CFTR inhibitors, added after S1611 preincubation, resulted in strong decrease of FSK-induced ∆JHCO3- in duodenal epithelium and a complete abrogation of FSK-induced ∆JHCO3- in colonic epithelium, did not influence duodenal FSK-induced ∆Isc, but resulted in a further decrease of colonic ∆Isc. This suggests that while the tested CFTR inhibitors cannot fully inhibit all FSK-induced CFTR-dependent electrogenic anion secretion in intestinal epithelium, most likely because they do not reach all areas in the epithelium where CFTR is expressed, they are still fairly effective in inhibiting the FSK-stimulated CFTR dependent HCO3- secretory response in WT mucosa.