Download
1 / 1
10 likes | 99 Vues
Supplementary Figure 1. ***. 120000. 100000. ***. 80000. 60000. Relative light units (RLU). 40000. 20000. 0. Dox. +. -. +. -. Line I. Line 2. rtTA. rtTA. A. MMTV- rtTA TET0-PELP1 Line 1. MMTV- rtTA TET0-PELP1 Line 2. B. TetO-PELP1. MMTV- rtTA. WT. + Dox. T7-PELP1.

E N D
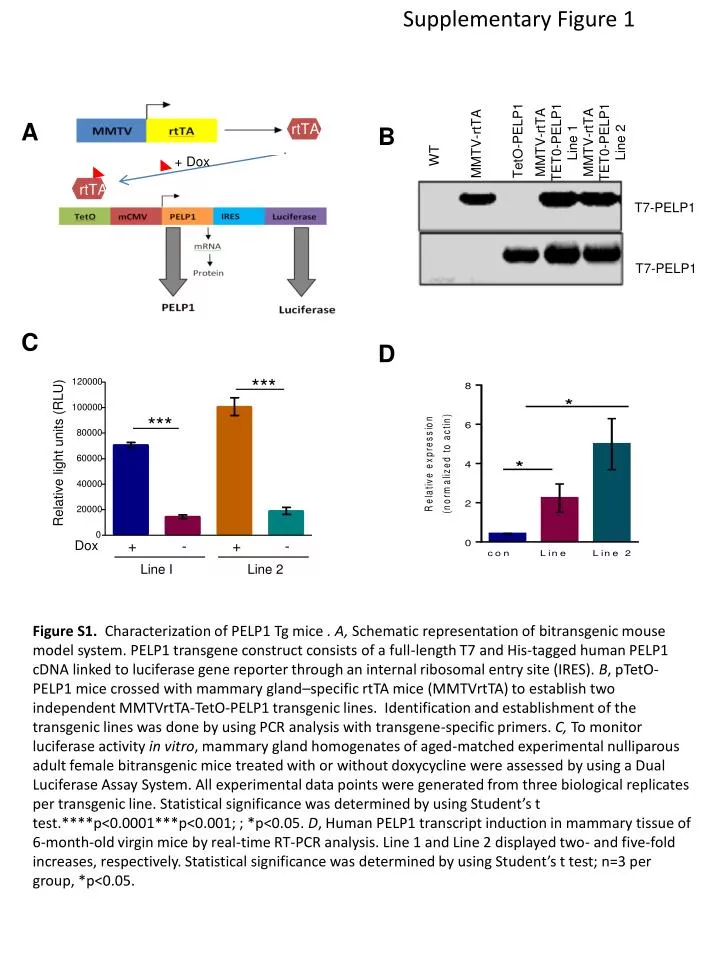
Supplementary Figure 1 *** 120000 100000 *** 80000 60000 Relative light units (RLU) 40000 20000 0 Dox + - + - Line I Line 2 rtTA rtTA A MMTV-rtTA TET0-PELP1 Line 1 MMTV-rtTA TET0-PELP1 Line 2 B TetO-PELP1 MMTV-rtTA WT + Dox T7-PELP1 T7-PELP1 C D Figure S1. Characterization of PELP1 Tg mice .A, Schematic representation of bitransgenic mouse model system. PELP1 transgene construct consists of a full-length T7 and His-tagged human PELP1 cDNA linked to luciferase gene reporter through an internal ribosomal entry site (IRES). B, pTetO-PELP1 mice crossed with mammary gland–specific rtTA mice (MMTVrtTA) to establish two independent MMTVrtTA-TetO-PELP1 transgenic lines. Identification and establishment of the transgenic lines was done by using PCR analysis with transgene-specific primers. C, To monitor luciferase activity in vitro, mammary gland homogenates of aged-matched experimental nulliparous adult female bitransgenic mice treated with or without doxycycline were assessed by using a Dual Luciferase Assay System. All experimental data points were generated from three biological replicates per transgenic line. Statistical significance was determined by using Student’s t test.****p<0.0001***p<0.001; ; *p<0.05. D, Human PELP1 transcript induction in mammary tissue of 6-month-old virgin mice by real-time RT-PCR analysis. Line 1 and Line 2 displayed two- and five-fold increases, respectively. Statistical significance was determined by using Student’s t test; n=3 per group, *p<0.05.