Download
1 / 7
70 likes | 163 Vues
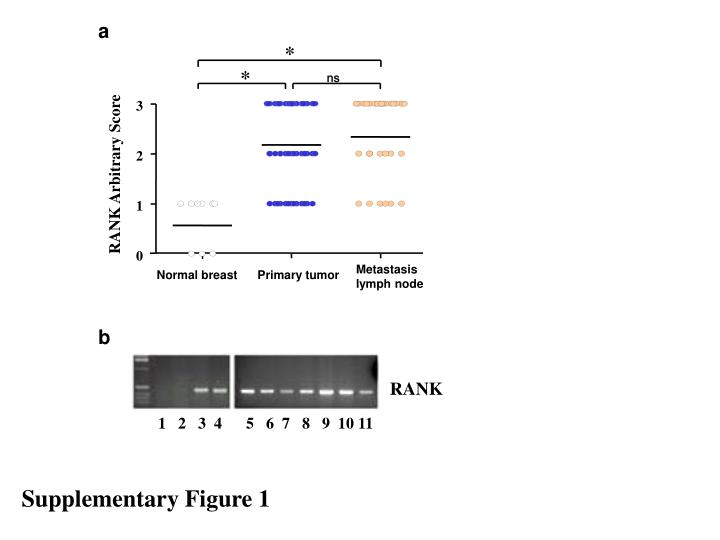
a. *. *. ns. 3. 2. RANK Arbitrary Score. 1. 0. b. RANK. 1 2 3 4 5 6 7 8 9 10 11. Metastasis lymph node. Primary tumor. Normal breast. Supplementary Figure 1. Prolactin. RANKL. RANKL. pERK1/2. pERK1/2. pAKT. ERK1/2. AKT. b -Actin. pSTAT5. STAT5.

E N D
a * * ns 3 2 RANK Arbitrary Score 1 0 b RANK 1 2 3 4 5 6 7 8 9 10 11 Metastasis lymph node Primary tumor Normal breast Supplementary Figure 1
Prolactin RANKL RANKL pERK1/2 pERK1/2 pAKT ERK1/2 AKT b-Actin pSTAT5 STAT5 0 5 10 30 60 min RANK min 0 5 10 20 40 5 10 20 40 Control RANKL 120000 60 RANKL / OPG 100000 50 80000 40 % survival 3H thymidine uptake (CPM) 30 60000 20 40000 10 20000 0 0 Control Day 1 Day 3 RANKL UV Control Sorbitol a b c d e Supplementary Figure 2 Anisomycin
120 100 80 % increased migration 60 40 20 0 SDF-1a [1mg/ml] RANKL [2.5mg/m] SDF-1a [1mg/ml] RANKL [1mg/ml] SDF-1a [0.1mg/ml] RANKL [2.5mg/ml] RANKL [2.5mg/ml] SDF-1a [0.1mg/ml] Supplementary Figure 3
a Control RANKL RANKL b c 160 * 120 Migration toward the tip, mm 80 Control RANKL 40 0 -40 RANKL RANKL OPG Control Supplementary Figure 4
a c 70 60 50 40 % increased migration * 30 RANK * 20 10 b-actin 0 SDF-1a 1 2 RANKL RANKL / OPG SDF-1a / OPG RANKL / a-CXCR4 SDF-1a / a-CXCR4 * 100 100 90 * 80 80 70 60 SDF-1a RANKL 60 % increased migration 50 % migration 40 pERK1/2 40 30 20 20 ERK1/2 10 0 0 0 3 10 30 60 120 min 0 3 10 30 min 6Ckine RANKL CTACK SDF-1a 6Ckine / RANKL CTACK / RANKL SDF-1a / RANKL b d Supplementary Figure 5
a 700 Control B16F10 600 * 500 Tibia Vertebra 400 Bone density (pQCT mg/cm3) 300 b 200 100 0 Total Cortical Trabecular Tumor Control c Supplementary Figure 6
Control Tumor Tumor / OPG a b c * * * * d e f g h i Supplementary Figure 7