Download
1 / 22
270 likes | 531 Vues
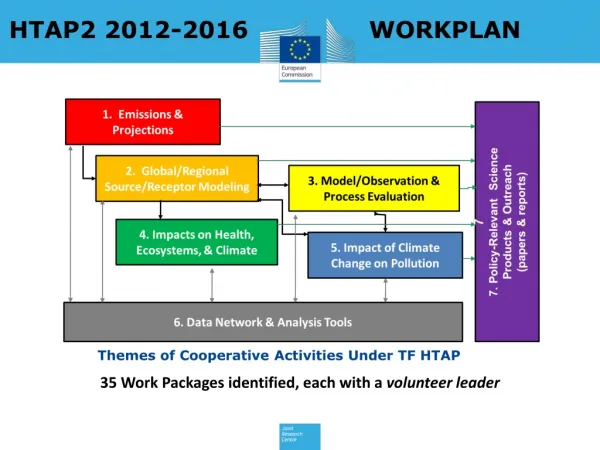
HTAP. Emission inventory: Status and Discussion. G. Janssens-Maenhout , F . Dentener , T. Keating , D. Guizzardi , M. Crippa , M. Muntean , G. Pouliot , Q. Zhang , J. Kurokawa , T. Ohara , R. Wankmüller , H. Denier van der Gon. WP objectives & steps Going beyond HTAP_v1

E N D
HTAP • Emission inventory: Status and Discussion • G. Janssens-Maenhout, F. Dentener, T. Keating, D. Guizzardi, M. Crippa, M. Muntean, G. Pouliot, Q. Zhang, J. Kurokawa, T. Ohara, R. Wankmüller, H. Denier van der Gon WP objectives & steps Going beyond HTAP_v1 Results of HTAP_v2.1 Outlook
Objectives • to develop HTAP_v2 harmonized emissions database for use in global and regional modeling for 2008 and for 2010. • 1. collecting emission gridmapsof CO, NMVOC, NOx, SO2, NH3, PM10, PM2.5, BC and OC for 2008 and for 2010 per sector and per region using : - US EPA covering North America, - TNO/ EMEP covering Europe, • - MICS-Asia (covering East Asia) - EDGAR4.3 (gapfilling Rest of countries) • 2. aggregating gridmaps to one global map of 0.1°x 0.1° • 3.repeating 1. and 2. but for monthly gridmapsor after having applied the EDGAR monthly profile on the annual regional map • 4.Possible extensions:- including agricultural waste burning • 5. For other pollutants (CH4, Hg, POPs)/ other sources we refer to - v4.2FT2010 for CH4 - GFED3 for fire emissions - GMOS for Hg and MSC-East for POPs • - T. Diehl for volcanic emissions of SO2
Objectives Years: 2008, 2010 Monthly time series available for US, MICS-Asia, EDGAR,not for EMEP Emission sources: Anthropogenic activities except Savannah burning and LULUCF and Agricultural waste burning (not in MICS) Chemical substances: Air pollutants: CO , NMVOC, NOx , NH3 , SO2 Aerosols: PM10 , PM2.5 , OC , BC Spatial allocationat resolution: 0.1° x 0.1° available for US and EDGAR, 0.125°x0.0625° of TNO aggregated at 0.1°x 0.1° 0.1°x 0.1° for MICS-Asia but, some (e.g.India) at 0.25° x 0.25°
Step 1: Regional inventories Data source EMEP-TNO (MACC) Purpose: to make use of official emission inventories for the different regions that are already gridded.
Step 2: Sector specification EMEP-TNO (MACC) • Aggregation level most detailed common level of sectors (MICS) • We follow IPCC with extensive combustion sector, and large industry group • Issue with inland waterways (1A3d(i)): in S8, so only int. ships under 2_ships • Crude oil evaporation in tankers (1B2a(iv) -S5): under 4_industry (not 5_transport)
Lessons learned HTAP_v1 HTAP 2000 reasonably close to RCP 2000 Except for OC, HTAP 2000 is lower (up to 30% lower for VOC)
Lessons learned HTAP_v1 • Wishlist of the HTAP modellers community: • VOC speciation • Carbonaceous particle speciation • Height distribution • Recent year • Multipollutant point source has single location • Which spatial and temporal resolutions ? • Monthly ? • 0.1 º x 0.1 º ? Important is the localisation of point sources (requiring sector-specific details) • Which level of inconsistency is important ? • Multipollutant emission sources spatially smeared out • Mass balance of PM (in danger if BC/OC from other datasource) • Country totals: boundaries, partial coverage of country area (e.g. Russia) • Time-series consistency?
Status: HTAP_v2 Fundamental difference in approach: PATCHWORK of gridmaps EDGAR-HTAP_v1 was gridded with EDGAR proxy datasets HTAP_v2 is a compilation of gridmaps from other datasources, only spatially gapfilled with EDGARv4.3 gridmaps Challenges: different resolution, different projections, partial coverage of some countries, double coverage of some other countriesChoice for EMEP-TNO because of grid and consistent C speciation EMEP particulate matter: PM10, PM2.5 no BC, no OC EMEPgridmaps(50kmx50km) TNO particulate matter: PM10, PM2.5 BC, OC (+resuspended) TNOgridmaps(0.0625°x0.125°) (12.5kmx6.25km)
Status: HTAP_v2 CH4 2008 Check completeness of regional emission datasets via CO2 Comparison of CH4 MICS-Asia for CHN & JPN with EDGARv4.2FT2010
Results: HTAP_v2.1 Global view Regional anthropogenic emissions for 2008 and 2010 of primary gaseous pollutants (SO2, NOx, CO, NMVOC,NH3) and particulate matter components (PM10, PM2.5, BC, OC). Emissions are expressed in Tg of a specific pollutant per year.
HTAP_v2.1 gaseous pollutant 2008 Absolute emissions (Tg/year) are reported on top of each bar.
HTAP_v2.1 particulate matter 2008 Absolute emissions (Tg/year) are reported on top of each bar.
2008, Global 2008, China Tg SO2 TgSO2 Emission inventories comparison: SO2 SO2 int. shipping, 2010
2008, EU27 2008, China Emission inventories comparison: NOx TgNOx TgNOx NO2 ground transport, November 2010
Emission inventory comparison: CO & NMVOC 2008, China 2008, EU-27 EDGAR-HTAP_v2 Tg NMVOC Tg CO CO residential&waste, February 2010
Emission inventories comparison: NH3 2008 NH3 Tg NH3 NH3 agriculture, August 2010
HTAP_v2.1 Air pollutant emissions per capita Country Index: I= industrialised, E=emerging, D= developing
Emission inventory comparison: PM10 & PM2.5 2008, EU27 EU-27 Tg PM2.5 Tg PM10 PM10 residential&waste, January 2010
2008, China 2008, China Emission inventories comparison: BC & OC Tg OC Tg BC BC industry, November 2010
HTAP_v2.1 Aerosol emissions per capita Country Index: I= industrialised, E=emerging, D= developing
HTAP_v2.1 Where to find http://edgar.jrc.ec.europa.eu/htap_v2/index.php?SECURE=123 Or ftp://edgar@edgar.jrc.ec.europa.eu (passwd has to be left blank) HTAP_v2.1 online Full documentation: report in draft
Outlook: HTAP_v2 suggestions ? • For next HTAP_v2.2 version: • We welcome all user feedback, in particular also from modellers (using inverse models) • Is the geospatial resolution 0.1ºx0.1º and the monthly temporal resolution covering the needs of the HTAP modellers community ? • Which speciations ? In addition to the carbonaceous speciation also the NMVOC speciation? • Which further improvement: point sources data from e.g. EPRTR database, specification of height? • Which information on uncertainty ? Magnitude/ spatial correlation? 1. Use where possible point source data. Suggestion: EPRTR instead of UNFCCC and EMEP for Europe