Download

1 / 26
260 likes | 263 Vues
Transfers, Capital, and Consumption over the Demographic Transition: An International Comparison. Andrew Mason University of Hawaii at Manoa Ronald Lee University of California. Acknowledgements. Support – National Institutes of Health NIA R01 AG025488 and AG025247

E N D
Transfers, Capital, and Consumption over the Demographic Transition: An International Comparison Andrew Mason University of Hawaii at Manoa Ronald Lee University of California
Acknowledgements • Support – National Institutes of Health NIA R01 AG025488 and AG025247 • Computational work – Diana Wongkaren, Turro Wongkaren, Pablo Lattes, Tim Miller, and Gretchen Stockmayer
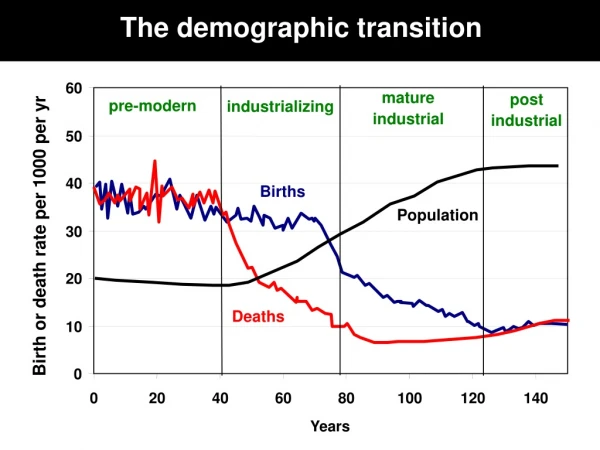
Key Ideas • Demographic transition is from high youth dependency to high old age dependency. • During the transition, low dependency yields the first demographic dividend. • Children and the elderly are similar in that neither work; however, • Elderly contribute to economic growth by accumulating assets. • This will lead to a second dividend.
Objective of Paper • Use a simulation model that incorporates detailed empirical data to analyze how • the demographic transition • the importance of family support systems • public policy • features of the economic life cycle • Influence asset demand, economic growth, and consumption
Theoretical Model • Economic lifecycle dictates that adults support children and accumulate pension wealth • Children are supported through a combination of public and familial transfers • Pension wealth comes in two exhaustive, mutually exclusive forms • Pension transfer wealth (from younger and future generations) • Assets • Composition of pension wealth is determined by policy
Theoretical Model • In the conventional lifecycle model, consumption at each age reflects tastes and individualistic lifetime budget constraint • In this model, consumption at each age is governed by altruism across generations and general standards of living
Theoretical Model • Closed form solution for the steady-state • Dynamics • Solve for steady-state in 2300 • Use backward recursion to solve for the paths of assets, consumption, and other macroeconomic variables • Work on a forward recursion solution is underway
Data • UN Population Data • 1950-2050: World Pop Prospects 2005 • 2050-2300: World Pop to 2300 • Economic lifecycle • Japan: Ogawa and Matsakura (2005) • South Korea: An and Gim (2006) • Thailand: Chawla (2006) • US and Taiwan: Lee, Lee, & Mason (2005)
Limitations of Current Analysis • Methodology for simulating dynamic results requires further testing and evaluation. • Model does not incorporate important feedbacks • Small open economy • Accumulation of assets does not lead to changes in interest rates or changes in labor productivity • In future work this will be a key feature of the analysis
Analysis of Economic Lifecycles and Steady States • Asset demand is increased by • Fertility decline • Increased life expectancy • More rapid economic growth • Lower interest rates • US type economic life cycle with high old age consumption • Early retirement • See paper for detailed calculations
Transfer policy Pension policy: Public transfers to children:
Key Points • For young populations, simulated assets and pension wealth are negative • Costs of children exceed resources of parents • Three possible outcomes • Accumulate foreign debt to finance child costs • Reduce spending on children below the relative level estimated for Taiwan in 1977 or the US in 2000 • Rely exclusively on transfer wealth to support old-age consumption
Key Points • Fertility decline leads to greater wealth (huge differences in Tk/Y across countries in the plots) • Rise in support ratio leads to increased per capita consumption at all ages and greater accumulation for retirement • Aging of adult population more wealth • If fertility decline leads to a rise in spending on children relative to adults • Assets will increase by less • Human capital may rise by more (video games or education?)
Key Points • Increased longevity and population aging lead to greater wealth • In US, ratio of assets to labor income increases • Doubles between 1950 and 1970 • Doubles again between 1990 and 2090 • In Brazil, ratio of assets to labor income increases by about 500% between 1950 and 2000
Key Points • Effects on consumption are quite modest • Small open economy assumption; no capital deepening effects, but large international capital flows and spill-overs to other countries • In a closed economy, a doubling of K/Y raises labor income and consumption by 40%, so we expect much bigger effects in fuller model. • Global aging will produce similar effects on a global scale.
In Conclusion • If aging leads exclusively to expanded public and familial transfer programs, economy is a fixed pie divided among more consumers. • If transfer programs are kept in check, aging leads to greater assets, a larger pie, and a second demographic dividend.
In Conclusion • Does not mean that consumption will rise relative to productivity, but that it will decline by less than the decline in the support ratio. • Consumption is lower per year of life, but lifetime consumption is higher