Download
1 / 17
170 likes | 273 Vues
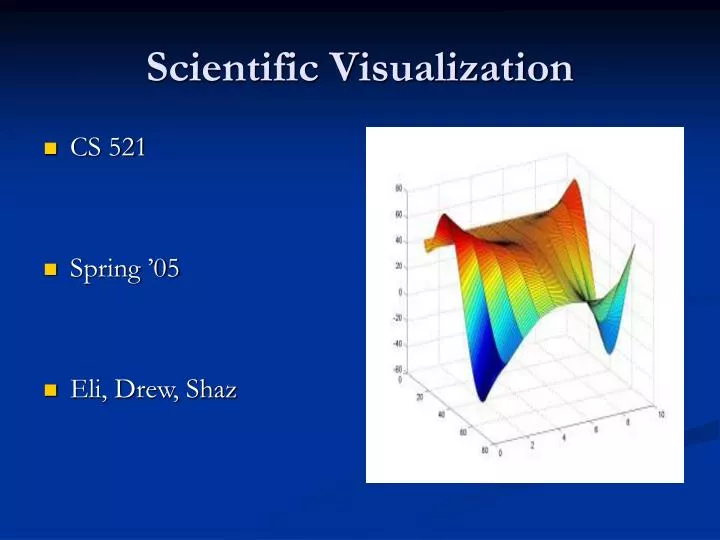
Scientific Visualization. CS 521 Spring ’05 Eli, Drew, Shaz. Introduction. SciVis utilizes computer graphics, image processing, signal processing as techniques to analyze numerical data. It makes it much easier to understand results of complex numerical data analysis

E N D
Scientific Visualization • CS 521 • Spring ’05 • Eli, Drew, Shaz
Introduction • SciVis utilizes computer graphics, image processing, signal processing as techniques to analyze numerical data. • It makes it much easier to understand results of complex numerical data analysis • The visualization helps scientists to interact and investigate with certain aspects of the data.
What it is? • The methodology of quickly and effectively representing data. • Humans perceive better than machines, and machines calculate much more consistently and accurately. • It is a combination of graphics capabilities in the 21st century with human perception.
The Need • Ability to deal with the randomness included in natures equations. • The larger amounts of test data capability, results of which are normally harder to see. • The largest test data available to us is one nature provides us with.
Quality Vs. Quantity • Quantity • Provides a bigger picture • Play with the whole data set • Quality • Ability to slice a subset of the data set. • Detail – oriented
History • Three stages of mdmv (multidimensional multivariate visualization) development • Searching stage (1782 – 1976) • Awakening stage (1977 – 1985) • Discovery stage (1987 – 1991)
Searching stage • Mdmv was to be studies long before computer science by statisticians and psychologists • All studies were in 2D xy displays due to lack of technology.
Awakening stage • Tukey came out with data analysis methods • 2D and 3D spatial data was commonly studied during the time. • It was not just a tool anymore but a way of understanding how to decode data
Discovery Stage • Moved away from just data analysis to very high graphical visualizations which required a lot of computation power. • Virtual reality brought new meaning to visualization techniques. • NFS declared the need for 2D/3D spatial visualization.
Breakdown • Independent variable – Dimension • Dependent variable – Variate • Equation – • Y = f(x) • Y is dependent on X
2D Visualization Example • Example of 2D visualization (charts) most commonly used in business applications.
3D Visualization Example • Reynard Motorsport Engineers recognized as leader in Formula 1 and Indy car design use Ensight to study airflows. • Voith hydro to design more efficient hydroelectric turbines less harmful to fish.
Motivations • The availability of increasingly powerful computers with extremely fast internal and external memory. • Compresses a lot of data into one picture (data browsing). • Reveals co-relations between different quantities both in space and time. • Possible to view data selectively and interactively in ‘real time’.
Foundations • Spatial – oriented • Still graphs used, all relevant data is displayed at the same time in a given space • Multiple view vs. multiple symbol • Multiple view – one display panel shows values of multiple variables simultaneously • Multiple symbol – Only one symbol is used but conditional relationships are shown in multiple panels.
Foundations • Temporal Oriented • Also known as Kinematic displays (Tukey and Tukey 1988) • Variations across time are utilized to depict higher dimensions instead of using all variables within given space and time.
References • http://pareonline.net/getvn.asp?v=8&n=17 • http://www.cse.ohio-state.edu/~crawfis/cis694L/ • SciVis presentation of spring ’03 CS521 • http://www.ceintl.com/industries/industries.html