Download

1 / 40
400 likes | 499 Vues
Scientific Visualization Tutorial. Visualization Tutorials Summer 2010. Monday 10 - 12 Introduction to Scientific Visualization (Erik) 1 - 3 Graphics and Images for Publication and Presentation (Laura) 3 - 4 Data Wrangling for Scientific Visualization (Erik) Tuesday

E N D
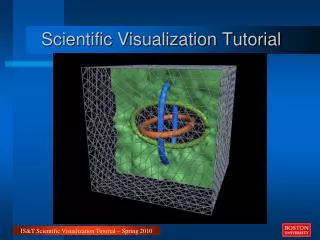
Scientific Visualization Tutorial IS&T Scientific Visualization Tutorial - Summer 2010
Visualization Tutorials Summer 2010 Monday 10 - 12 Introduction to Scientific Visualization (Erik) 1 - 3 Graphics and Images for Publication and Presentation (Laura) 3 - 4 Data Wrangling for Scientific Visualization (Erik) Tuesday 1 - 3 Scientific Visualization Using ParaView (Ray) 3 - 5 Scientific Visualization Using VTK (Ray) IS&T Scientific Visualization Tutorial - Summer 2010
Visualization Tutorials Summer 2010 Erik Brisson Raymond Gasser Laura Giannitrapani ebrisson@bu.edu rayg@bu.edu laura@bu.edu IS&T Scientific Visualization Tutorial - Summer 2010
HPC Tutorials Summer 2010 Next week Mon 1 - 4 Code Tuning and Parallelization Tues 1 - 4 Parallelization with OpenMP Wed 10 - 12 Tuning MATLAB Codes For Better Performance Wed 1 - 4 MATLAB Parallel Computing Toolbox Thu 10 - 12 Introduction to MPI, Part One Thu 1 - 4 Introduction to MPI, Part Two IS&T Scientific Visualization Tutorial - Summer 2010
Topics • Introduction • Scientific data domains • Visualization techniques • Matlab for Visualization • VTK and Paraview • OpenGL, OpenSceneGraph, Maya • DAFFIE and the display wall • Designing a visualization workflow for your project IS&T Scientific Visualization Tutorial - Summer 2010
BU Scientific Computing & Visualization IS&T Scientific Visualization Tutorial - Summer 2010
SCV Provides • High-performance, parallel computing systems and networks • Scientific code parallelization and optimization • Scientific data visualization • High-performance and high-resolution interactive three-dimensional graphics • Virtual environments/virtual reality • Consulting and training • Network-based video conferencing and collaboration tools IS&T Scientific Visualization Tutorial - Summer 2010
What is sci-vis? Could mean many things (e.g., plotting, illustration) Combination of 3-D graphics technology and human perception of objects in space IS&T Scientific Visualization Tutorial - Summer 2010
The Visualization Pipeline Math Proc Scientific visualization Computer Graphics 191 214 206 113 134 135 101 120 135 102 119 147 113 129 165 117 131 170 125 138 170 158 168 195 219 227 246 244 251 255 249 254 255 197 202 222 157 163 187 156 161 190 165 172 200 218 224 246 250 255 255 252 255 251 251 255 252 245 249 250 251 255 255 188 192 204 196 200 212 234 238 250 177 181 192 111 114 133 122 121 155 154 151 194 182 176 220 243 240 255 253 252 255 250 251 246 254 254 252 255 255 255 255 255 255 254 254 254 255 255 255 255 255 255 254 254 254 255 255 255 249 249 249 249 249 249 252 252 252 255 221 155 255 255 255 255 255 255 255 255 255 255 255 255 255 255 255 255 255 255 255 255 255 255 255 255 255 255 255 253 253 253 252 252 252 252 252 252 253 253 253 255 255 255 255 255 255 255 255 255 IS&T Scientific Visualization Tutorial - Summer 2010
The Visualization Pipeline - Hardware Field instruments Scientists/programmers Supercomputers Graphics machines Publications, movies/DVDs, web Demos, educational software IS&T Scientific Visualization Tutorial - Summer 2010
The Visualization Pipeline - Software Data acquisition and preparation Sci-vis tools Geometric Representation Rendering Post-processing IS&T Scientific Visualization Tutorial - Summer 2010
Many possible workflows Data Matlab VTK OpenGL Maya IDL Paraview OSG Photoshop Gnuplot DAFFIE Performer Premier Xmgrace Excel IS&T Scientific Visualization Tutorial - Summer 2010
Scientific data domains IS&T Scientific Visualization Tutorial - Summer 2010
Regular grid IS&T Scientific Visualization Tutorial - Summer 2010
Perimeter grid IS&T Scientific Visualization Tutorial - Summer 2010
Generalized grid IS&T Scientific Visualization Tutorial - Summer 2010
General mesh IS&T Scientific Visualization Tutorial - Summer 2010
Sample data at discrete points IS&T Scientific Visualization Tutorial - Summer 2010
Interpolating domain - triangulation IS&T Scientific Visualization Tutorial - Summer 2010
Interpolating domain – general polygons IS&T Scientific Visualization Tutorial - Summer 2010
Visualization Technigues Scalar data in 3D IS&T Scientific Visualization Tutorial - Summer 2010
Technique: Points (glyphs) on grid IS&T Scientific Visualization Tutorial - Summer 2010
Technique: Points randomized offset IS&T Scientific Visualization Tutorial - Summer 2010
Technique: Cutplanes IS&T Scientific Visualization Tutorial - Summer 2010
Technique: Regions of Interest IS&T Scientific Visualization Tutorial - Summer 2010
Technique: Isosurface IS&T Scientific Visualization Tutorial - Summer 2010
Technique: Isosurface w/cutplanes IS&T Scientific Visualization Tutorial - Summer 2010
Technique: Isosurface w/ROI IS&T Scientific Visualization Tutorial - Summer 2010
Transparent isosurface w/cutplanes IS&T Scientific Visualization Tutorial - Summer 2010
Colored isosurface w/cutplanes IS&T Scientific Visualization Tutorial - Summer 2010
Colored transpisosurface w/cutplanes IS&T Scientific Visualization Tutorial - Summer 2010
Multiple colored transpisosurfaces IS&T Scientific Visualization Tutorial - Summer 2010
Multi isosurfaces w/cutplanes IS&T Scientific Visualization Tutorial - Summer 2010
Technique: Mapping onto isosurface IS&T Scientific Visualization Tutorial - Summer 2010
Technique: Volume Visualization IS&T Scientific Visualization Tutorial - Summer 2010
Visualization Technigues Vector data in 3D IS&T Scientific Visualization Tutorial - Summer 2010
Technique: Vector glyphs IS&T Scientific Visualization Tutorial - Summer 2010
Technique: Vector field streaklines IS&T Scientific Visualization Tutorial - Summer 2010
Technique: Vector field ribbons IS&T Scientific Visualization Tutorial - Summer 2010
End of Overview IS&T Scientific Visualization Tutorial - Summer 2010