Download
1 / 22
220 likes | 337 Vues
An application of the logistic curve to the modeling of CO 2 emission reduction. Kazushi Hatase Graduate School of Economics, Kobe University. The model and simulations of this study. Model: RAMLOG. Global economy is viewed as a two-sector Ramsey model

E N D
An application of the logistic curve to the modelingof CO2 emission reduction Kazushi Hatase Graduate School of Economics, Kobe University
The model and simulations of this study Model: RAMLOG • Global economy is viewed as a two-sector Ramsey model • Energy sector of the model consists of two technologies: • Fossil fuel • New carbon-free technology • Diffusion of new technology is modeled by a logistic curve and learning-by-doing Simulations • Varying the potential speed of technological change and the learning rate • Investigating the implication of the above two factors on the optimal CO2 emission reduction pathways, cost of emission reduction and carbon tax levels Rokko Forum, Kobe University
Model of global economy (the Ramsey model) • Intertemporal utility maximization Lt:labor inputsrt: pure time preference; rt = r0 exp(-dr t) Production function At:total factor productivityEt:energy inputspt: energy price • Capital accumulation • Income accounts identity Rokko Forum, Kobe University
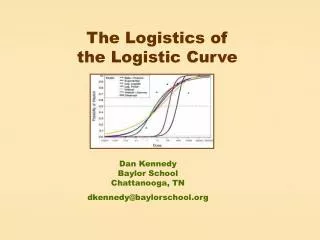
Logistic curve • Share of the new technology grows following a logistic curve St:share of new technology:coefficient • The equation above is modified into the following inequality form: • We use a finite difference form in the computer program: Rokko Forum, Kobe University
Logistic curve (continued) • Coefficient determines the speed of diffusion in the standard logistic function • It determines the “potential” speed of diffusion in the inequality form • In the inequality form, diffusion trajectory can take any paths under the logistic curve Rokko Forum, Kobe University
Learning-by-doing • Assuming that the cost of new energy declines as experience increases Wt:cumulative experienceb:experience index • Data of experience index(source: McDonald & Schrattenholzer, 2001) Rokko Forum, Kobe University
Learning-by-doing in the computer program • Using a finite difference form (Anderson & Winne, 2004) • Substituting Wtby the cumulative installed capacity of new technology :plant’s depreciation rate of new technology • Estimation of W0 (Gerlagh and van der Zwaan, 2004) :growth rate of new energy Rokko Forum, Kobe University
Combining the Ramsey model, logistic curve and learning-by-doing Ramsey model Learning by doing Logistic curve Rokko Forum, Kobe University
Climate change model • Adopt a simple CO2 accumulation model (Grubb et al., 1995) • Anthropogenic CO2 emission • Natural CO2 emission(Nordhaus, 1999) Rokko Forum, Kobe University
Simulation scenarios • Simulation is lead to a time path of emissions that satisfies the stabilization target of 550 ppm (cost-effectiveness simulation) • Investigating how • Potential speed of technological change (coefficient a) • Leaning rate (experience index:b) affect the optimal CO2 emission reduction • Model runs and parameter settings STC: Slow Technological Change FTC: Fast Technological Change LL: Low Learning HL: High Learning Rokko Forum, Kobe University
Common parameters • For the parameters of the Ramsey model, RICE-99 (Nordhaus, 1999) and MERGE (Manne et al., 1995) are referred. • Energy inputs are measured in the equivalence of giga-tons of carbon (GtC) following RICE-99 (Nordhaus, 1999). • For the parameters of energy costs, Anderson and Winne (2004) is referred. • CO2 accumulation model is calibrated by using the simulation results of a large-scale global climate model (Taylor et al., 1995) • Cost parameters Rokko Forum, Kobe University
Calibration of the production function • Production function at t=0 • Differentiating both sides and rearranging as follows: • A0 is obtained by: Rokko Forum, Kobe University
Optimal CO2 emission pathways • Four emission pathways are not very different. • Learning-by-doing has almost no effect in STC (Slow Technology Change). Rokko Forum, Kobe University
WRE emissions paths • Obtained by Wigley, Richels and Edmonds (Wigley et al., 1996). • Support deferring CO2 emission reduction. Rokko Forum, Kobe University
Optimal CO2 reduction pathways • FTC + HL is a little similar to the WRE emissions paths. • The other three paths (either Slow TC or Low L) are flatter. Rokko Forum, Kobe University
Optimal technology switch timing • Four pathways diverge much more than those of optimal CO2 reduction. • Larger learning rate makes the starting point of diffusion earlier. Rokko Forum, Kobe University
Emission reduction by energy input reduction and by new energy 1. STC + LL 3. FTC + LL 2. STC + HL 4. FTC + HL Rokko Forum, Kobe University
Cost reduction of new energy • Cost reduction largely depends on the learning rate. Rokko Forum, Kobe University
Loss of GWP through CO2 emission reduction • GWP loss largely depends on the learning rate. • The larger the coefficient , the smaller is GWP loss (but, minor influence). Rokko Forum, Kobe University
Carbon tax levels • Slow technological change or large learning rate leads to a larger carbon tax. • Carbon tax levels with the same learning rate are nearly the same up to the mid 21st century. Rokko Forum, Kobe University
Discussions • Some studies claim that the influence of learning-by-doing on the optimal CO2 reduction is negligible. But, this study shows that learning-by-doing can affect emission reduction paths. Moreover, learning-by-doing has a significant influence on technology switch timing. • The optimal CO2 reduction paths are relatively similar between the 4 model runs, while the optimal technology diffusion paths diverge. This can be explained by the proportion of the emission reduction done by energy input reduction and technology switch. • In the early period, emission reduction is mostly done by energy input reduction. • The results suggest that learning-by-doing creases positive externalities of innovation, reducing emission reduction costs and carbon tax levels. Rokko Forum, Kobe University
Points to improve the paper • Making the parameters less dependent on Nordhaus’ RICE-99. • Considering the increase of fossil fuel costs. • GWP loss and carbon tax levels are high compared to some other studies. • Comparison of WRE emissions paths and the emissions paths of this study is not convincing enough. • Adding the figure of “CO2 reduction by energy input reduction and by new energy”. • Rewriting the explanation about optimal CO2 reduction paths and optimal technology switch timing. • Figure 4 “cost reduction of new energy” may not be necessary. Rokko Forum, Kobe University