Download
1 / 31
310 likes | 313 Vues
This study aims to evaluate the impact of small loan programs on firm growth in Romania. Using panel data from 1992 to 2006, the study examines the effects of USAID-supported loans on employment, sales, and survival rates. The findings shed light on the potential benefits of small business loan programs in promoting growth in the country.

E N D
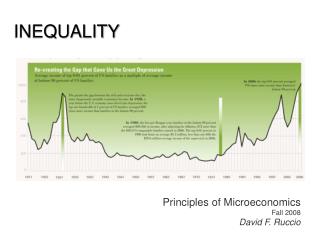
Estimating the Firm-Level Growth Effects of Small Loan Programs Using Universal Panel Datafrom Romania J. David Brown (US Census Bureau) John S. Earle (Upjohn Institute and CEU) June 2010
Motivation: small firms and the crisis What are the prospects for a “small business-fueled employment recovery”? Recent credit boom was smaller for small/young firms, and current credit crunch is worse New policy proposals around the world. In US: SBA stimulus Sen. Warner: Fed and TARP funds to small firms– including loss-sharing FDIC: matching loans to small business
Do small business loan programs promote growth? • Conceptually ambiguous: • Easier access to finance may enable expansion • But funds may be used for other purposes • Displacement and substitution effects • Empirically difficult (absent an experiment): • Many factors influence firm growth (industry, region, size, age…) • Need long time series on factors and outcomes – pre and post • Selection bias – loan could reflect growth potential • Many studies of firm growth, but no rigorous evaluations • N.B.: few such policy evaluations at firm-level more generally (except Jarmin, 1998)
Broader question: growth and finance Do well-functioning financial markets enhance growth, or does economic growth improve financial markets? (Rajan & Zingales 1998; Beck et al. 2000; Fisman & Love 2007) Macro debate: relationship of real and monetary economy Aggregate studies of loans and growth find different results for US states and Euro-zone countries (Driscoll 2004; Cappiello et al. 2010) Relatively little micro evidence, especially rigorous estimates of causal effects
Small business and finance in transition and development • Transition • IFIs: size of new private business indicates progress • Policy debate: finance versus property rights, contracts, regulation • Development • Microcredit is fashionable but few estimates of firm-level growth effects (many of repayment & poverty, Morduch 1999; Karlan&Morduch 2009) • Alternatives: technical assistance, business environment
Our case: small business loans in Romania • USAID-supported programs through March 2001 • Small size: 372 firms (=> rationing, few spillovers) • Partial coverage: 18/41 counties (=> ineligibles) • Loan conditions: • “Commercial terms”; lenders “profit-oriented” • Decisions based on past years’ accounting cash-flow • State-owned and some sectors ineligible, startups not immediately eligible • Romanian context: credit markets poorly developed • For most recipients, first access to formal credit
Estimating effect of first international loan on growth (ATT): Our method • Construct two control groups from universal panel data • Eligible non-recipients (same county) • Ineligibles (non-USAID counties) • Match on several years of pre-loan characteristics • Outcomes: growth (employment & sales); survival • Panel DiD regressions using matched samples, 1992-2006 • Pre- and post-dynamics of the effect • Pre-loan: diagnose selection bias (“pseudo-outcomes”) • Post-loan: long- versus short-term effects
Data • List of 372 firms receiving a USAID loan by March 2001 – most in 1999-2000 • Annual balance sheet information for universe of registered firms from 1992-2006: about 200,000 firms per year • Exclusions • All “old” firms (ever have any state ownership) • Ineligible industries (tobacco, weapons) • >49 employees (only small and micro start-ups left)
Matching • Heterogeneity: recipients versus nonrecipients • Industry (manufacturing) • Age (older) • Size (smaller in early years, larger later) • Exact matching • Always: 2-digit industry, age, year • Sometimes: county, +/- 10% t-1 outcome, 3-digit ind • Propensity score matching • Lagged outcomes(to t-4), other characteristics • Nearest neighbor, radius, kernel methods
Control Groups • Same county (eligible non-recipients) • Exact match on county • Selection problem (applicants and loan officers) • Non-USAID county (ineligibles) • No matching on county • No self-selection problem • Possible program selection & heterogeneity • P-scores estimated from relationship in USAID counties
Specification Checks • Identifying assumption: unconfoundedness • Balancing tests for covariates • Rosenbaum-Rubin standardized differences (bias) • t-tests • Hotelling’s T2 test by P-score quintiles • Smith-Todd regression test • “Pseudo-outcome” (Imbens-Wooldridge) tests • Pre-treatment outcomes (Heckman-Hotz 1989) • Estimation using two control groups (Rosenbaum 1987; Heckman et al. 1997)
Pseudo-outcome test: 2 control groups • Definitions • Yi(1), Yi(0) = outcomes for treatment, non-treatment • Gi∊{-1, 0, 1} (2 control groups, 1 treatment group) • Wi= 0 if Gi = -1, 0; Wi= 1 if Gi = 1 • Unconfoundedness requires Yi(0), Yi(1) ╨ Wi|Xi • Stronger condition: Yi(0), Yi(1) ╨ Gi|Xi => Yi(0) ╨ Gi | Xi , Gi∊ {-1, 0} • Test: E[E(Yi|Gi=-1, Xi ]- E[E(Yi|Gi=0, Xi ]=0
Results: Estimates of the Loan Impact on Employment (NN matching)
Estimates of the Loan Impact on Employment (Kernel matching)
Estimates of Loan Effects on Exit (Cox proportional hazards)
Conclusion • Results suggest loans have long-lasting effects on job and sales growth, but little on survival • Evidence of causal link: finance -> growth • Mechanism unclear • lower cost of capital • alleviate credit rationing • open access to formal credit markets • Approach (data, methods) widely applicable • Loan programs in other countries (SBA) • Other policies with differential effects on firms
Implications for the US? SBA Project Previous Research: • Studies of local employment growth and per capita income as a function of the amount of SBA loans, but not effect on loan recipients • Urban Institute (2008) study for SBA • Dun & Bradstreet data • Incomplete coverage of small firms • Biased toward larger, more successful recipients • No control group of non-recipients
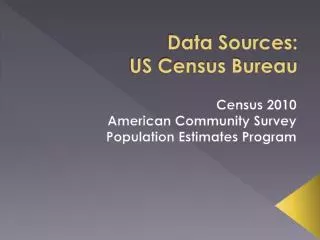
SBA Project (with Census Bureau) SBA has detailed data on loan recipients: Name and address Loan date Loan amount Interest rate Credit score at time of application Demographic information about borrower Loan performance Also some data on rejected applicants
SBA Project (with Census Bureau) Link SBA to Census data for all establishments in 1976-2008 on age, employment, payroll, industry code, etc. Subset of the Census Bureau establishments have sales, capital stock, and profit Match to select controls most similar to loan recipients prior to loan Compare performance of recipients and non-recipients before and after the loan 2nd control group: rejected applicants