Download
1 / 28
440 likes | 1.19k Vues
Remote Sensing Theory & Background . GEOG370 Instructor: Christine Erlien. Overview. What is remote sensing Brief remote sensing history Photography enables remote sensing Film, then digital; balloons satellites Satellite remote sensing Resolutions Scanner types Platforms.

E N D
Remote Sensing Theory & Background GEOG370 Instructor: Christine Erlien
Overview • What is remote sensing • Brief remote sensing history • Photography enables remote sensing • Film, then digital; balloons satellites • Satellite remote sensing • Resolutions • Scanner types • Platforms
What is Remote Sensing? Remote far away Sensing things from a distance Remote sensing is the science and art of obtaining information about a target through the analysis of data acquired by a device that is not in contact with the target under investigation. What we see & why Eyes: Sunlight is reflected onto our nerve cells in the retina. What we see: Visible spectrum (blue, green, red wavelengths) Remote sensing equipment allows us to sense electromagnetic radiation beyond the visible spectrum
Silk Road, China Waterless plains of southern Algeria Grand Canyon http://www.remotesensingart.com/
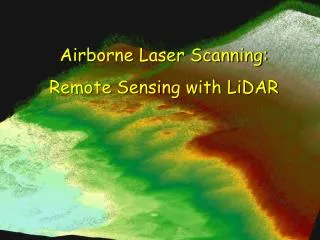
Types of Remote Sensing • Type Based on source of the energy recorded by the sensor • Passive Remote Sensing: Energy collected by sensors is either reflected or emitted solar radiation. • Reflected – must be collected during daylight hours • Emitted – day or night as long as emissions large enough to record • Active Remote Sensing: Energy collected by sensors is actively generated by a man-made device. • Examples: Radar, LIDAR (Light Detection and Ranging)
Active and Passive Remote Sensing AVHRR Thermal Image http://www.coml.org/edu/tech/count/srs1.htm QuikSCAT radar image http://nsidc.org/seaice/study/active_remote_sensing.html
Particle=photon Wavelength Solar Radiation Electromagnetic radiation energy: Wave-particle duality. Light speed: c=f c = speed of light (186,000 miles/second) f = light frequency: number of waves passing a reference per unit time (e.g., second). The amount of energy carried by a photon: = hf h=Planck’s constant (6.62610-34 Js) Note: The shorter the radiations’ wavelength, the higher its frequency the more energy a photon carries
Atmospheric windows Solar Electromagnetic Radiation
First Remote Sensing Image Tree Rooftop 1st permanent photograph (remotely sensed image), by Niepce in 1826. http://www.artlex.com/ArtLex/p/images/photo_niepce.lg.jpg
Remote Sensing of Large Areas Early remote sensing limited by means available to put the sensor (i.e., camera) high above the target The means: 1. Balloons 2. Pigeons 3. Gliders 4. Aircraft 5. Satellite http://rst.gsfc.nasa.gov/Front/overview.html
Military Intelligence Remote sensing a critical source of military intelligence for WWI & WWII, Cold War Remains a critical source of intelligence today Examples: WWI: British reconnaissance aerial photography revealed a major change in direction of the German forces advancing on Paris allowed the Allied army to fortify its position and hold off the German advance to Paris WWII: German barges identified in canals near the coast of France in summer of 1940. British launched an air attack on the invasion forces Germany forced to postpone & eventually abandon invasion
Cold War: U-2 Aircraft • Balloons can be easily shot down high altitude aircraft called the U-2 built to collect remotely sensed data • U-2 flies at 70,000 ft, putting it beyond the range of surface-to-air missiles & other aircraft (at that time) • Remains a valuable means of collecting remote sensing data today • President Bush used it during Gulf War in 1991 • President Clinton used it in the war in Bosnia in 1998-99 Cuba, 1962
Military Intelligence & Image Resolution 1 meter 2.5 meter 5 meter 10 meter 10 cm 25 cm 50 cm 100 cm http://rst.gsfc.nasa.gov/Intro/Part2_26e.html http://www.fas.org/irp/imint/resolve3.htm
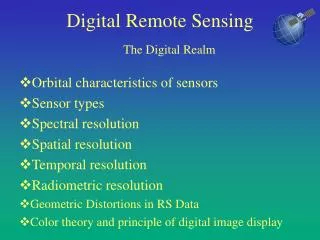
Satellite Remote Sensing • Resolutions • Spatial: Area visible to the sensor • Spectral: Ability of a sensor to define fine wavelength intervals • Temporal: Amount of time before site revisited • Radiometric: Ability to discriminate very slight differences in energy • Scanner types • Along-track • Across-track
Across-track scanning • Scan the Earth in a series of lines • Lines perpendicular to sensor motion • Each line is scanned from one side of the sensor to the other, using a rotating mirror (A). • Internal detectors (B) detect & measure energy for each spectral band, convert to digital data • IFOV or Instantaneous Field of View (C) of the sensor and the altitude of the platform determine the ground resolution cell viewed (D), and thus the spatial resolution. • The angular field of view (E) is the sweep of the mirror, measured in degrees, used to record a scan line, and determines the width of the imaged swath (F). http://ccrs.nrcan.gc.ca/resource/tutor/fundam/chapter2/08_e.php
Along-track scanning • Uses forward motion to record successive scan lines perpendicular to the flight direction • Linear array of detectors (A) used; located at the focal plane of the image (B) formed by lens systems (C) • Separate array for each spectral band • Each individual detector measures the energy for a single ground resolution cell (D) • May be several thousand detectors • Each is a CCD • Energy detected and converted to digital data • “Pushed" along in the flight track direction (i.e. along track). • “Pushbroom scanners” http://ccrs.nrcan.gc.ca/resource/tutor/fundam/chapter2/08_e.php
Civil Remote Sensing Earth Resources Technology Satellite (ERTS-1; renamed Landsat 1) 1st satellite launched for peaceful purposes (1972) Satellite Launched Decom RBV MSS TM Orbit Landsat-1 23 Jul 1972 6 Jan 1978 1-3 4-7 none 18d/900km Landsat-2 22 Jan 1975 25 Feb 1982 1-3 4-7 none 18d/900km Landsat-3 5 Mar 1978 31 Mar 1983 A-D 4-8 none 18d/900km Landsat-4 16 Jul 1982 -- none 1-4 1-7 16d/705km Landsat-5 2 Mar 1984 -- none 1-4 1-7 16d/705km Landsat-6 5 Oct 1993 Launch Failure none none ETM 16d/705km Landsat-7 15 Apr 1999 -- none none ETM+ 16d/705km RBV: Return Beam Vidicon MSS: Multispectral Scanner TM: Thematic Mapper Decom: decommissioned
Landsat Data transmission to the ground, allows fast & efficient data delivery
Landsat Orbit Sun-synchronous orbit: Satellite always crosses the equator at precisely the same local time
Landsat Temporal Resolution Temporal Resolution: The shortest time needed to repeat the ground track
Landsat Swath Width & Field of View Landsat Field of View 705km Satellite ground track scene Spatial Resolution 175km 185 km Pixel size= (30x30m)
Landsat 7 ETM+ Spectral Bands Spectral resolution: The number of bands and the width of spectrum that each sensor covers
255 Digital numbers (DN) 0 Radiance intensity Maximum Radiance Minimum Radiance RadiometricResolution The number of levels of DN values is determined by the radiometric resolution of the instrument. For example, 8-bit system can differentiate 256 (0-255) levels of radiance
Landsat Images Alaska’s Aleutian Islands Mississippi River Delta http://earthasart.gsfc.nasa.gov
SPOT (Systeme Pour l’Observation de la Terre) • Along track scanning system (Pushbroom System) • Sensors are pointable • Allows repeat coverage from different angles • Increases potential frequency of coverage of areas where cloud cover is a problem • Ability to collect stereoscopic imagery Temporal resolution=26 days Radiometric resolution=8-bit
SPOT Imagery http://www.spotimage.fr/automne_modules_files/gal/edited/r444_santiago3D_800x600.jpg
Ikonos Owner: Space Imaging Temporal resolution: 11 days Radiometric resolution: 11-bit Spectral bands spatial resolution Blue (0.45-0.52 4m Green (0.51-0.60) 4m Red (0.63-0.70) 4m NIR (0.76-0.85) 4m Panchromatic (0.45-0.90) 1m Swath width: 11km Orbit: Sun-synchronous; equatorial crossing time of 10:30am