Download
1 / 23
230 likes | 366 Vues
Postprandial Serum Fructose Levels in Patients Tested for Diabetes. Mary Beth Patterson, M.D. Pediatric Endocrinology Harbor-UCLA Medical Center. Objectives. Background of Fructose Consumption Fructose Metabolism Negative Effects Associated with Fructose

E N D
Postprandial Serum Fructose Levels in Patients Tested for Diabetes Mary Beth Patterson, M.D. Pediatric Endocrinology Harbor-UCLA Medical Center
Objectives • Background of Fructose Consumption • Fructose Metabolism • Negative Effects Associated with Fructose • Study Results – Postprandial serum fructose levels • Next study: fructose challenge
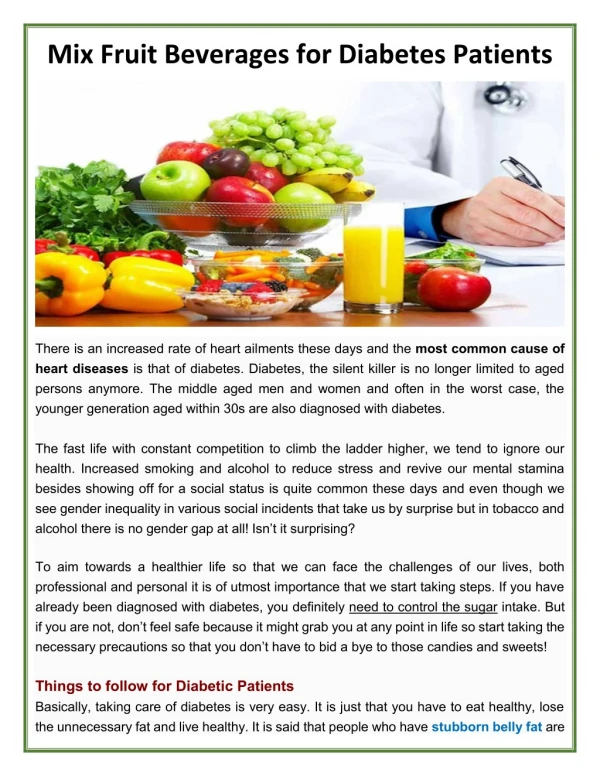
Background – Fructose Consumption • Obesity epidemic in the U.S. and developed countries has been linked to increased consumption of fructose and sucrose. • High fructose corn syrup (HFCS) added to many soft drinks contains 55% fructose and 45% glucose. • As the amount of soft drink consumption has increased over the past few decades, so has the percentage of the population classified as obese. • Fructose sweeteners comprise 5-7% of the calories in the typical U.S. diet.
Stats • In 1994-1996 the average person had daily added sugar intake of 79 gms (316 kcal/d or 15% energy intake) – half was fructose • Soft drink consumption per person – 90 servings/yr in 1942 600 servings/yr in 2000 • Soft drink consumption among kids increased 41% between 1989/91 and 1994/96 • 24% U.S. kids BMI > 85th percentile, 11% have BMI > 95th percentile • Overweight kids more likely to be heavy soft drink consumers
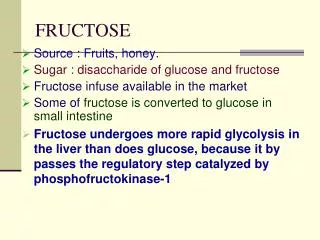
Fructose Metabolism • A typical U.S. diet includes consumption of 85-100 grams of fructose daily • Large amounts of fructose exposed to the liver lipogenesis and TG accumulation reduced insulin sensitivity and hepatic insulin resistance/glucose intolerance • Small amounts of fructose have been shown to decrease the glycemic response to glucose loads and improve glucose tolerance
Fructose • High levels of fructose consumption have been associated with: • Retinopathy, nephropathy, increased uric acid, increased lactate, insulin resistance • Fructose may cause obesity by: • Decreasing satiety, not stimulating insulin and leptin, not inhibiting ghrelin
Fructose Metabolism • Fructose enters hepatocytes where it is metabolized by fructokinase with consumption of ATP lactic acid and uric acid generated • Uric acid stimulates vascular smooth muscle cell proliferation and release of chemotactic and inflammatory substances, induces monocyte chemotaxis, inhibits endothelial cell proliferation and migration, and causes oxidative stress in adipocytes
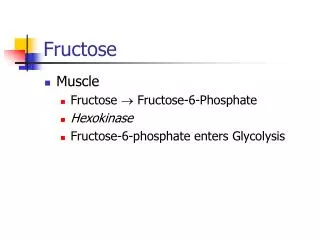
Fructose Metabolism • Fructose is able to by-pass the main regulatory step of glycolysis – the conversion of G-6-P to F-1,6-P2 – controlled by phosphofructokinase • Fructose can uncontrollably produce glucose, glycogen, lactate, and pyruvate • Fructose does not stimulate secretion of insulin from pancreatic beta cells like glucose does • Insulin-regulated leptin will also be reduced and have a decreased effect on reducing appetite
Fructose Metabolism • Teff showed that fructose failed to decrease ghrelin while decreasing insulin and leptin concentrations • Decreased satiety and increased food intake during long-term fructose consumption
Fructose Metabolism • Another possible mechanism for insulin resistance caused by fructose involves the GLUT5 transporter • GLUT5 was found to have a higher level of expression in obese rats • With age and the development of diabetes, the GLUT5 activity was compromised leading to even more insulin resistance
Fructose • Small study of adults with type 2 diabetes • OGTT ± 7.5 gms fructose • Insulin and glucose levels lower in those receiving fructose • Increased lactate levels in those receiving fructose • No differences in fatty acids, glycerol, or TG concentrations
Fructose & Glucose Metabolism • Study in patients with type 2 DM showed that fructose may improve glucose tolerance by stimulating net hepatic glucose uptake via enhanced translocation of glucokinase
Defending HFCS • www.hfcsfacts.com (Corn Refiners Association) defends the widespread use of high fructose corn syrup and states that it is safe and no different from other common sweeteners • Benefits include keeping food fresh, enhancing flavor, retaining food moisture, maintaining consistent flavors, keeping ingredients evenly dispersed • HFCS not the cause of current rise in obesity or diabetes • Cites research studies demonstrating that HFCS has no effect on leptin, ghrelin, TG, uric acid, or feelings of fullness
Fructose Study • Fructose level in serum is difficult to measure due to low concentration of fructose and possible interference from high glucose levels. • Initial objective was to develop a gas chromatography / mass spectroscopy (GC/MS) assay to determine plasma fructose and glucose levels on random postprandial samples from patients being evaluated for diabetes. • The assay was based on common derivatization techniques of monosaccharide into its respective methoxyamine acetate derivatives • D-Fructose and D-Glucose were used as internal standards
Results • In 43 postprandial samples, plasma glucose ranged from 2.69 to 14.75 mM with a mean and standard deviation of 6.51 ± 3.52 mM. • Plasma fructose levels ranged from 9.75 to 112.86 µM with a mean and standard deviation of 35.3 ± 25.08 µM. • There was no correlation between plasma glucose and fructose concentrations.
Fructose Study • The next part of the study will consist of a fructose challenge. • 2 groups of teenagers – one group will have type 2 DM and one group will be obese – will be given a beverage that contains high fructose corn syrup • Plasma samples will be taken at 5 points for each patient that will then be used to measure glucose and fructose levels • These values will be used to establish fructose and glucose disappearance rates in these two groups of patients
Fructose Study • Additional fructose levels will also be determined on samples from patients known to have pancreatic cancer. These values can then be compared with the original samples to see if cancer cells make fructose. • Fructose levels will also be measured from various consumer products – including different types of soda known to contain high fructose corn syrup.
References • Anderson GH. Much ado about high-fructose corn syrup in beverages: the meat of the matter. The American Journal of Clinical Nutrition. 2007;86:1577-78. • Basciano H, et al. Fructose, insulin resistance, and metabolic dyslipidemia. Nutrition & Metabolism. 2005;2(5):1-14. • Bray GA, et al. Consumption of high-fructose corn syrup in beverages may play a role in the epidemic of obesity. The American Journal of Clinical Nutrition. 2004;79:537-43. • Bray GA. How bad is fructose? The American Journal of Clinical Nutrition. 2007;86:895-6. • Macdonald I, et al. Some effects, in man, of varying the load of glucose, sucrose, fructose, or sorbitol on various metabolites in blood. The American Journal of Clinical Nutrition. 1978;31:1305-1311. • French SA. National trends in soft drink consumption among children and adolescents age 6 to 17 years: prevalence, amounts, and sources, 1977/78 to 1994/1998. Journal of the American Dietetic Association. 2003;103:1326-1331. • Funari, VA, et al. Fructose metabolism in the cerebellum. The Cerebellum. 2007;6:130-140. • Gao X, et al. Intake of added sugar and sugar-sweetened drink and serum uric acid concentration in US men and women. Hypertension. 2007;50:306-312. • Hawkins M, et al. Fructose improves the ability of hyperglycemia per se to regulate glucose production in type 2 diabetes. Diabetes. 2002;51:606-614. • Johnson RJ, et al. Potential role of sugar (fructose) in the epidemic of hypertension, obesity and the metabolic syndrome, diabetes, kidney disease, and cardiovascular disease. The American Journal of Clinical Nutrition. 2007;86:899-906.
References • Kawasaki T, et al. Postprandial plasma fructose level is associated with retinopathy in patients with type 2 diabetes. Metabolism. 2004;53(5):583-88. • Ludwig DS, et al. Relation between consumption of sugar-sweetened drinks and childhood obesity: a prospective, observational analysis. The Lancet. 2001;357:505-508. • Macdonald I, et al. Some effects, in man, of varying the load of glucose, sucrose, fructose, or sorbitol on various metabolites in blood. The American Journal of Clinical Nutrition. 1978;31:1305-1311. • Moore MC, et al. Acute fructose administration decreases the glycemic response to an oral glucose tolerance test in normal adults. The Journal of Clinical Endocrinology & Metabolism. 2000;85(12):4515-19. • Moore MC, et al. Acute fructose administration improves oral glucose tolerance in adults with type 2 diabetes. Diabetes Care. 2001;24(11):1882-87. • Nakagawa T, et al. A causal role for uric acid in fructose-induced metabolic syndrome. American Journal of Physiology Renal Physiology. 2006;290:F625-F631. • Teff KL, et al. Dietary fructose reduces circulating insulin and leptin, attenuates postprandial suppression of ghrelin, and increases triglycerides in women. The Journal of Clinical Endocrinology & Metabolism. 2004;89(6):2963-72.