Download
1 / 1
10 likes | 149 Vues
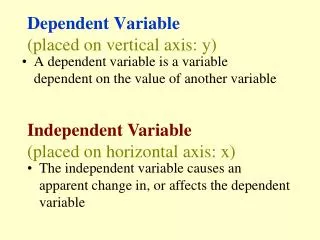
N. elevation, m. Upper Rio Grande. 200. 1100. 2200. 4300. 2001 2002. Slum. URG MC USJ WC Lilly. Slum USJ WC Lilly. Slum USJ WC Lilly.

E N D
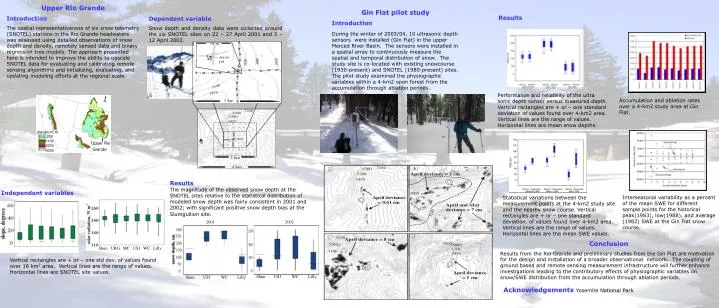
N elevation, m Upper Rio Grande 200 1100 2200 4300 2001 2002 Slum. URG MC USJ WC Lilly Slum USJ WC Lilly Slum USJ WC Lilly Upper Rio Grande Introduction The spatial representativeness of six snow telemetry (SNOTEL) stations in the Rio Grande headwaters was assessed using detailed observations of snow depth and density, remotely sensed data and binary regression tree models. The approach presented here is intended to improve the ability to upscale SNOTEL data for evaluating and calibrating remote sensing algorithms and initializing, evaluating, and updating modeling efforts at the regional scale. Gin Flat pilot study Introduction During the winter of 2003/04, 10 ultrasonicdepth sensors were installed (Gin Flat) in the upper Merced River Basin. The sensors were installed in a spatial array to continuously measure the spatial and temporal distribution of snow. The study site is co-located with existing snowcourse (1930-present) and SNOTEL (1980-present) sites. The pilot study examined the physiographic variables within a 4-km2 open forest from the accumulation through ablation periods. Results Dependent variable Snow depth and density data were collected around the six SNOTEL sites on 22 – 27 April 2001 and 3 – 12 April 2002. Performance and reliability of the ultra sonic depth sensor versus measured depth. Vertical rectangles are + or – one standard deviation of values found over 4-km2 area. Vertical lines are the range of values. Horizontal lines are mean snow depths. Accumulation and ablation rates over a 4-km2 study area at Gin Flat. Results The magnitude of the observed snow depth at the SNOTEL sites relative to the statistical distribution of modeled snow depth was fairly consistent in 2001 and 2002; with significant positive snow depth bias at the Slumgullion site. Independent variables Interseasonal variability as a percent of the mean SWE for different sample points for the historical peak(1983), low(1988), and average (1982) SWE at the Gin Flat snow course. Statistical variations between the measurement points at the 4-km2 study site and the nearby snow course. Vertical rectangles are + or – one standard deviation. of values found over 4-km2 area. Vertical lines are the range of values. Horizontal lines are the mean SWE values. Conclusion Results from the Rio Grande and preliminary studies from the Gin Flat are motivation for the design and installation of a broader observational network. The coupling of ground based and remote sensing measurement infrastructure will further enhance investigations leading to the contributory effects of physiographic variables on snow/SWE distribution from the accumulation through ablation periods. Vertical rectangles are + or – one std dev. of values found over 16 km2 area. Vertical lines are the range of values. Horizontal lines are SNOTEL site values. w/ AVIRIS albedo w / constant albedo Acknowledgements YosemiteNational Park

![The Impact of [independent variable] On [dependent variable] Controlling for [control variable]](https://cdn0.slideserve.com/430545/the-impact-of-independent-variable-on-dependent-variable-controlling-for-control-variable-dt.jpg)