Download
1 / 19
190 likes | 315 Vues
Some Preliminary Modeling Results on the Upper-Level Outflow of Hurricane Sandy (2012). JungHoon Shin and Da-Lin Zhang Department of Atmospheric & Oceanic Science, University of Maryland . On the Genesis of Hurricane Julia (2010).

E N D
Some Preliminary Modeling Results on the Upper-Level Outflow of Hurricane Sandy (2012) JungHoon Shin and Da-Lin Zhang Department of Atmospheric & Oceanic Science, University of Maryland
On the Genesis of Hurricane Julia (2010) • Cecelski, S., and D.-L. Zhang, 2013: Genesis of Hurricane Julia (2010) within an African Easterly wave: Low-level vortices and upper-level warming. Journal of the Atmospheric Sciences, 70, 3799-3817. • Cecelski, S., D.-L. Zhang, and T. Miyoshi, 2014: Genesis of Hurricane Julia (2010) within an African easterly wave: Developing and non-developing members from WRF-LETKF ensemble forecasts. Journal of the Atmospheric Sciences, in press. • Cecelski, S., and D.-L. Zhang, 2014: Genesis of Hurricane Julia (2010) within an African easterly wave: Sensitivity analysis of WRF-LETKF ensemble forecasts. Journal of the Atmospheric Sciences, in press. • Cecelski, S., and D.-L. Zhang, 2013: Genesis of Hurricane Julia (2010) within an African easterly wave: Sensitivity to ice microphysics. To be submitted to Monthly Weather Review.
Outline • Overview • Model description and verification • Upper-level outflow, inertial instability, and hurricane reintensification • Summary and conclusions
Stage 1 Stage 2 Stage 3 Stage 4 Time series of the best track (PMIN in blue, and VMAX in red) and the RMW from Hwind analysis.
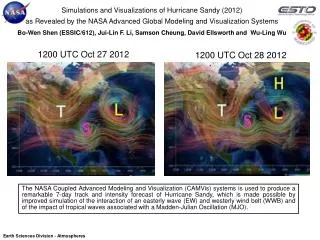
2220Z24 (Stage 1) 1040Z 26 (Stage 2) 1400Z27 (Stage 3) 1330Z29 (Stage 4) Satellite image showing the evolution of Sandy at 2220 UTC 24, 1040 UTC 26, 1400 UTC 27, and 1330 UTC 29 October 2012.
850 hPa NCEP analysis at 00Z 29 Oct, when Sandy underwent re-intensification. 850 hPa wind vectors and isotherm (red: °C) with hourly accumulated precipitation from TRMM (shaded, mm) 200 hPa wind vectors, wind speed (shaded, m/s) and geopotential height (blue, m) The thick solid line denotes the best track of Sandy, and black squares give Sandy’s location at each 00 UTC. 200 hPa
Questions to be addressed: (i) How is the convectively generated upper-level outflow defined with respect to the eyewall convection and spiral rainbands?
A conceptual model of the hurricane’s inner-core structures From Liu, Zhang and Yau (1999)
Questions to be addressed (continues): (ii) Was the re-intensification of Sandy caused by the approaching upper-level jet stream or the low-level forcing, including frontal lifting? If yes, how to prove it? If not, why could Sandy reintensify in a less favorable environment compared to its earlier stages? (iii) How was the upper-level outflow related to the secondary circulations of Sandy? Are the upper outflow changes in intensity and coverage passive or active during its reintensification stage?
WRF domains and SSTs. -Blue simulated WRF track -Black: best track Sandy’s location is marked at every 00UTC. WRF physics options
Stage 4 Stage 4 Stage 1 Stage 2 Stage 3 Stage 1 Stage 2 Stage 3 (a) (b) (a) Simulated (blue) and observed (red) PMIN, plus the 200-850 hPa vertical wind shear (1000 km × 1000 km). (b) Simulated (blue) and observed (red) VMAX.
Time-radius cross section of the azimuthally averaged 900 hPa tangential wind speed (shaded, m/s) from the western semicircle. Dashed lines are for the radius of maximum wind.
(b) 12Z 27 Oct (c)12Z 28 Oct (a) 06Z 26 Oct 200 hPa wind vectors, wind speed (shaded, m s-1) and geopotential height (blue). (a) 06Z 26 Oct (b) 12Z 27Oct (c) 12Z 28 Oct 850 hPa wind vectors, isotherm (red, 3°C intervals), and hourly rainfall (shaded, mm)
(d) 12Z 28Oct (a) 04Z 25Oct (b) 06Z 26Oct (c) 12Z 27Oct 900-hPa radar reflectivity (shaded,dBZ). The storm is centered in the domain (960km × 960 km). c. 12 Z 27 d. 12 Z 28 a. 04Z 25 b. 06Z 26 900 hPa wind vectors with speeds shaded (m/s), and isobar (contoured at 5 hPaintervals). The storm is centered in the domain (960km × 960 km).
Roles of the upper-level inertial instability in the reintensification of Sandy • We have shown that the simulated re-intensification begins around 18Z 27 Oct, which coincides with the enhanced across-isobaric outflow into the upper level jet. It is caused by stronger pressure gradient force aloft. That is, we may consider the outward acceleration of air parcels caused by imbalance between centrifugal, pressure gradient and Coriolis force. • The outward radial acceleration (dUrad/dt) can be calculated by
Time-azimuth distribution of the 175-275 hPa averaged & radial averaged (450~500 km) outward acceleration due to inertial instability (shaded: × 104, m s-2) and the 175-275 hPa averaged radial mass flux [contoured: × 102, kg/(m2 s)] at R= 450 km from the storm center. Time - azimuth distribution of the 500-hPa vertical mass flux [× 102, kg/(m2 s)] that is radially averaged from R= 50 to 250 km.
Summary and conclusions • Sandy was a well-predicted storm; • The upper-level outflow appears to be more associated with spiral rainbands than the eyewall convection; and • The presence of upper-level inertial instability coincides with large outward mass fluxes, indicating the favorable conditions for deep convection.
Future work • More analyses are needed to reveal the three-dimensional structures of the upper outflow layer and their relation to deep convection in the eyewall and spiral rainbands, CAPE and moisture source; • Piecewise PV inversion will be used to reduce the influence of the upper-level jet stream to see how it would affect Sandy’s reintensification;