Download

1 / 27
270 likes | 553 Vues
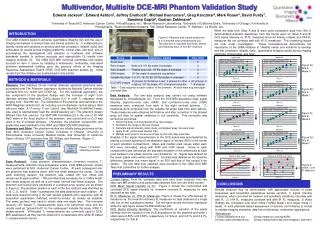
3D Slicer Training. Tumor Segmentation from DCE-MRI with the SegmentCAD module. Vivek Narayan, Jayender Jagadeesan Brigham and Women ’ s Hospital Harvard Medical School jayender@bwh.harvard.edu. April 24, 2014. Objective of this Module.

E N D
3D Slicer Training Tumor Segmentation from DCE-MRI with the SegmentCAD module Vivek Narayan, Jayender Jagadeesan Brigham and Women’s Hospital Harvard Medical School jayender@bwh.harvard.edu April 24, 2014
Objective of this Module • Segment regions of angiogenesis corresponding to the tumor from DCE-MRI • DCE-MRI should have a minimum of two post-contrast + one pre-contrast images • Typically, for breast tumor segmentation we use DCE-MRI with 4 post-contrast + pre-contrast images • Segmentation of the tumor is based on black-box method of estimating the slope of wash-in and wash-out of contrast
Segmentation Algorithm • Voxels (Ve) with initial enhancement > 75% are highlighted • Slope of delayed curve Sd = (I4-I1)/I1 • For Vevoxels, overlay label map with following colors: • Red for washout curve (Sd < -0.2 | Type III) • Yellow for plateau curve (-0.2 < Sd < 0.2 | Type II) • Blue for persistent curve (Sd > 0.2 | Type I)
Example case Pre-contrast First post-contrast Second post-contrast Third post-contrast Fourth post-contrast Tumor map overlaid on Pre-contrast
Slicer module • This tutorial will guide you through the process of loading DCE-MRI and segmenting the regions of angiogenesis (corresponding to tumor) using the “SegmentCAD” module in 3D Slicer.
Prerequisites -64-bit platform -Download “Breast DCE-MRI Dataset 1” under Data Sets from the Module Wiki: http://www.slicer.org/slicerWiki/index.php/Documentation/Nightly/Modules/SegmentCAD Optional -BRAINSfit registration of DCE-MRI images -Image noise filters (Median Image Filter and Curvature Anisotropic Diffusion modules in 3DSlicer)
Part 1: The SegmentCAD module is part of the OpenCAD extension. Download the OpenCAD Extension from the Slicer Extension Manager in the “Segmentation” category.
Load DCE-MRI data Click on “Load Data”
Choose Directory Click on “Choose Directory to Add” Point to the directory containing the DCE-MRI volumes Click on “Choose”
Part 3: Create a Label Map mask Reason: To speed up computation. Only the voxels within the mask (ROI) are analyzed
Editor Module Choose the “Editor” module Click Apply
Mask Using Threshold Set Master Volume to Pre Name of label is automatically set to Pre-label Click on the button for “ThresholdEffect”
Mask Using Threshold Set to 18.50 Set to 539.00 Click on “Apply”
Part 4: Segment tumor from DCE-MRI using the SegmentCADmodule
Switch to SegmentCADmodule Choose “Segmentation” Under “Segmentation” choose the “SegmentCAD” module
Selecting Input Volumes Choose “Pre” Choose “Vol1” Choose “Vol2” Choose “Vol3” Choose “Vol4” Choose “Pre-label” Enable this checkbox
Set Output Parameters Click on “Create new Volume” Automatically set to “SegmentCADLabel Map” Keep all other parameters at the default settings Click on “Apply SegmentCAD”
Post-Segmentation • Layout switches to “Conventional Quantitative” • Red Slice displays “SegmentCADLabel Map” overlaid on pre-contrast image • 3D viewer displays Volume Rendering of “SegmentCADLabel Map” • Quantitative viewer graphs %-increase from pre-contrast of voxel under mouse cursor throughout all input Volumes.
Display Tumor Label Map Tumor in Volume Rendering of Label Map Graph of voxelat mouse location (Pre: 0.0, Vol1: 1.0, … , Vol4: 4.0) “SegmentCADLabel Map” overlaid on images
Find Tumor in Label Map Visible Tumor Scroll through Axial View
Refine the Segmentation Enable “Calculate SegmentCADLabel statistics” Change the Minimum Threshold to 100.00% Click on “Apply SegmentCAD”
Label Statistics New “SegmentCADLabel Map” generated Label Map statistics displayed in the GUI
Label Statistics • Care should be taken while interpreting the label statistics since voxels within the heart which also show contrast enhancement over time are detected by the algorithm