Download

1 / 35
350 likes | 594 Vues
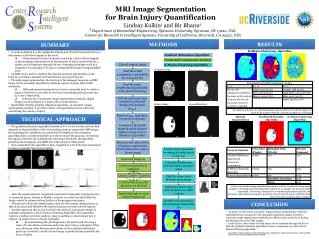
Detection and Segmentation of Stroke Lesions from Diffusion Weighted MRI of the Brain. Presented by: Shashank Mujumdar. What is Stroke?. Imaging Modalities:. Need : The accurate location and size of the stroke helps clinicians to classify the stroke sub-type and plan for treatment .

E N D
Detection and Segmentation of Stroke Lesions from Diffusion Weighted MRI of the Brain Presented by: ShashankMujumdar
What is Stroke? Imaging Modalities: • Need: • The accurate location and size of the stroke helps clinicians to classify the stroke sub-type and plan for treatment. • Accurate stroke diagnosis helps in understanding the functional consequences and may predict the eventual outcome. • Hence, early detection and accurate segmentation of ischemic stroke (regardless of size and location) is essential. • Challenges: • Difficult to identify lesions without pre-processing the data. • Data inherently noisy and with low resolution. • Difficult to specify lesion boundaries accurately. • Segmentation of lesions difficult due to low resolution and noisy data. • Window of recovery is small (< 6 hrs). • Stroke is a medical condition caused due to inadequate supply of blood (lack of oxygen) to the brain cells which damages them and may result in their death. • Blood flow may be interrupted due to one of the following: (i) A clot in the blood vessel occludes the supply. (ii) A blood vessel rupture disturbs the supply. • Stroke caused due to (i) is referred to as ischemic stroke and that due to (ii) is referred to as hemorrhagic stroke. • Ischemic Stroke accounts for around 80% of all strokes! CT DWI
Auto-Windowing of Ischemic Stroke Lesions in Brain DWI Mujumdar et. al. ICMIT, 2013, IIT-KGP, India.
Need for Windowing • DWI acquisition is done using the standard Echo Planar Imaging (EPI) Technique. • EPI induces a trade-off between signal-to-noise ratio (SNR), time of acquisition and resolution of the acquired image. • Since the time of acquisition is significantly less (<1 min), EPI compromises the resolution as well as the SNR of acquired DWI scans. • A linear transform for contrast enhancement is desired which preserves the relative contrast among the tissues. • The wide dynamic range (12-16 bit data) poses a problem for image analysis tasks such as segmentation which operate on lesion contrast since subtle intensity changes may get lost. • A solution is to perform windowing for contrast enhancement of the stroke lesions.
Processing Pipeline • Obtain Candidate Lesions • Obtain Lesion Masks • Generation of CNR Plots • Estimate Window Parameters
Obtain Candidate Lesions • We start with the following observations • Stroke volume << brain volume • Infarct Appears brighter than the brain tissue • Pixels belonging to lesions will give rise to short peaks at the higher end of volume histogram. • The data is thresholded at the knee-point and pixels with intensities greater than the threshold are retained. • A connected component analysis gives the candidate lesions. • Components with size less than 5% of the image dimension are ignored. Knee-Point
Obtain Lesion Masks • For the given set of candidate lesions the lesion masks are obtained. • A bounding box around the lesion with a 3 pixel margin is considered as the lesion mask.
Generate CNR Plot • Two plots are generated for a given volume data • CNR(l,w) • max(CNR(w)) • Contrast to noise ratio (CNR) is defined as, • mc= mean of the core • σc = std of the core • mb= mean of the background • σb= std of the background The normal brain tissue in the bounding box is considered as the background. The normal brain tissue is estimated from the ADC maps.
Estimate Window Parameters • The desired optimum level (lo) is found from CNR(l,w) and is taken to be the value of l corresponding to the highest CNR value. • The desired optimum width (wo) is chosen such that the variation in max{CNR(w)} is below a threshold. • The choice of the optimum window level (lo) is intuitive. • The choice of the optimum width (wo) is the width value, above which the contrast of the lesions is not affected significantly.
Quantitative Assessment • The assessment aimed at determining the effectiveness of the approach across multiple diffusion weighting (b1000 and b2000). • We report on two different types of assessments • A mirror region of interest analysis (MRA) • A contrast improvement ratio analysis (CIR)
Mirror Region of Interest Analysis • Given a lesion, it was flipped about the mid-line and the corresponding mirror region in the contra-lateral hemisphere was found. • This can also be viewed as a measure of contrast enhancement in a global sense where the improvement in contrast of the lesion is measured against the normal brain tissue globally, represented by the mirrored region. • The improvement in contrast is computed as ,
Contrast Improvement Ratio Analysis • Given a lesion, the core and it’s background were found as described earlier. • This can also be viewed as a measure of contrast enhancement in a local sense where the improvement in contrast of the lesion is measured against the normal brain tissue locally, represented by the background region. • The improvement in contrast is computed as ,
Results • Windowing is more effective to data obtained from scanner-2 relative to scanner-1. • The voxel size, matrix size and the pixel depth of the data obtained from scanner-1 is higher. • Data from scanner-2 has poorer contrast and is noisier relative to data from scanner-1. • Hence the values of CIR and CMI after windowing are more in data from scanner-2 relative to scanner-1.
Improvement in Lesion Definition • Improvement in lesion definition is assessed by performing a coarse segmentation task. • The segmentation is performed by simple thresholding at the knee-point as described earlier. B2000 Windowed B2000 Original B1000 Windowed B1000 Original • The results show that windowing operation helps in • Reducing false positives. • Capturing true extent of the lesions. B2000 Windowed B2000 Original B1000 Original B1000 Windowed True-Positive False-Positive False-Negative
Perception Study • Conducted to validate results from radiologist’s point of view. • Objective • Note response time in classifying presented DWI slice as normal or abnormal. • Note number of lesions in the presented DWI slice. • Stimuli • 64 slices consisting of windowed and non-windowed data from two scanners with two b-values consisting of different sized lesions. • Participants • 8 radiologists from CARE hospital, Hyderabad with mean experienceof 9.82 ± 9.97 years. (max = 29 years, min = 0.6 years) • Method • Radiologists were randomly presented with the stimuli and the responses were noted. • Environment • The experiment was set up in the hospital environment on the monitor regularly used by the radiologists for analysing patient data in order to avoid introducing bias in the obtained results due to different monitor settings (resolution, contrast, brightness settings).
Results of t-Test • The mean response times were reduced by 14.17% & 12.04% for Experts and Learners respectively. • Statistical hypothesis testing is done using t-test which calculates the p-value. • p < 0.05 is considered to be statistically significant. (RT = Response Time)
Size-based Analysis • The (-) sign indicates a reduction while a (+) sign indicates an increase. • Windowing helps Learners more with smaller lesions which is crucial from a diagnostic point of view. • Response time (RT) is not affected due to lesion size for Experts. • Experts took marginally more time to analyze normal slices after windowing.
Conclusion • A novel automated windowing technique was presented for diffusion weighted MRI. • The technique was shown to significantly improve the contrast of ischemic stroke lesions present in the DWI scan. • The proposed method is effective for different b-valued DWI scans (b1000 and b2000) and robust to data acquired from different scanners with different acquisition processes. • Improvement in the lesion definition suggests the effectiveness of the approach as pre-processing step for contrast enhancement. • The perception study performed with expert radiologists and detailed analysis of the results indicates the effectiveness of the algorithm for clinical usage from the radiologist’s point of view.
Stroke Detection and Segmentation From Brain DWI Scans With Multiple b-Values. Mujumdar et. al. ICPR, 2012, Japan.
Related Work • Broad classification of methods • Manual • May provide accurate results but are labor intensive and operator dependent. • Semi-automated • Rely on operator intervention in tuning the algorithm parameters or to initialize the algorithm. • Automated • Generally fail to capture small-sized lesions in the data. - J.D. Eastwood et al. AJNR, 2003. - KN BhanuPrakash et al. CARS, 2008. - B. Stein et al. MICCAI, 2001.
Imaging with High b-Value • b-Value • Determines the strength and duration of the diffusion gradients (the diffusion sensitivity)during DWI acquisition. • Advantages of high b-value • The attenuation of the healthy tissue is higher relative to the lesions which gives rise to improved lesion conspicuity. • Disadvantages of high b-value • The TE increases and thus the SNR of the resulting scan is compromised. • Accentuated anisotropic effects in regions where white matter tracts are prominent. B1000 B1000 B2000 B2000 Stroke Lesion Stroke Lesion Zoomed Sub-Image Of Lesion Zoomed Sub-Image Of Lesion - H.J. Kim et al. AJNR, 2005. - M.C. Delano and Y. Cao, NIC, 2002.
Concept • The b2000 data with high sensitivity for stroke is suitable for finding candidate locations • Will have high number of false positive locations (FP) due to anisotropy effects. • The b1000 data (with low anisotropy effects) and the ADC (impervious to shine-through artifacts) are appropriate to help reject the FPs. • Segmentation is performed on the obtained lesion candidates.
Processing Pipeline (B) (C) Obtain Windowed Result Level Set Based Segmentation Obtain Lesion Candidates DWI Volume (A) (B) (C) Obtain Window Parameters (B) Obtain Segmentation Results Candidate Refinement Stage 1: Lesion Detection Stage 2: Data Pre-processing Stage 3: Lesion Segmentation
Qualitative Results True-Positive False-Positive False-Negative
Descriptive Statistics • Our dataset contained 324 large-sized lesions and 286 small-sized lesions. • High median values of SN, SP and DC with corresponding low CV values indicate that the segmentation algorithm is robust to size and shape variations in lesions. • The datasets were acquired from two different scanners with different acquisition protocols and the algorithm appears to be robust to these factors.
Experiments & Analysis of Results • Experiment 1: Effectiveness of the b2000 data in the detection stage. • Detection of smallest early ischemic changes, proven to be better in b2000 over b1000. • To validate this hypothesis for the collected data, the sensitivity vs. specificity curves were generated for detection of small lesions ( <1% image size) by varying the knee-point. - H.J. Kim et al. AJNR, 2005.
Experiments & Analysis of Results • Experiment 2: The experiment aimed to study the degree of improvement in the segmentation accuracy (at the boundaries) due to b2000 data. • The segmentation was performed on b1000 and b2000 data separately, for only true lesion locations (found from GT), for all the volumes. • The median DC values for the segmentation results were 0.68 and 0.83 for b1000 and b2000 data respectively. • An improvement of 22.06% in the segmentation accuracy was observed on b2000 data.
Performance Evaluation of Proposed Framework • The performance evaluation aimed at a differential analysis with respect to size of the lesions, comparing the ROC plots between 4 methods • Method described in *. • Segmentation on lesion candidates obtained on b1000. • Segmentation on lesion candidates obtained on b2000. • Segmentation on lesion candidates obtained utilizing b1000, b2000 & ADC (our method). • Based on the lesion size, the ROC plots were generated for the following cases • segmentation of small-sized (<1% of image size) lesions. • segmentation of large-sized (>1% of image size) lesions. • segmentation of all the lesions in the data. Small-Sized Lesions Large-Sized Lesions All Lesions Sensitivity values correspond to 95% Specificity. - KN BhanuPrakash et al. CARS, 2008.
Qualitative Analysis of Detection and Segmentation Results Ground Truth b1000 True-Positive False-Positive False-Negative The accuracy of the segmented results is directly dependent on the accuracy of the detection results. b2000 Integrated
Conclusions • Novel technique is proposed. • Utilizes multiple b-values (b1000 & b2000) and the ADC maps. • Adapts to data acquired from multiple scanners with different acquisition processes. • Automated. • Experiments and analysis validate the superiority of the method in detection and segmentation. • Signifies role of b2000 data. • Superiority over methods utilizing only b1000 data. • Limitation. • Computationally expensive framework due to additional data processing. • The performance of the system outweighs the computational burden.