Download

1 / 33
330 likes | 454 Vues
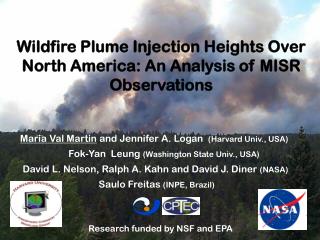
Wildfire Plume Injection Heights Over North America: An Analysis of MISR, MODIS and a 1-D Plume-rise Model. Maria Val Martin and J. Logan (Harvard Univ., USA) D. Nelson, C. Ichoku, R. Kahn and D. Diner (NASA, USA) S. Freitas (INPE, Brazil)

E N D
Wildfire Plume Injection Heights Over North America: An Analysis of MISR, MODIS and a 1-D Plume-rise Model Maria Val Martin and J. Logan (Harvard Univ., USA) D. Nelson, C. Ichoku, R. Kahn and D. Diner (NASA, USA) S. Freitas (INPE, Brazil) F.-Y. Leung (Washington State Univ., USA) Research funded by NSF and EPA
Wildfire Plume Injection Heights Over North America: An Analysis of MISR, MODIS and a 1-D Plume-rise Model Outline • An statistical analysis of aerosol injection heights over North America • The use of a 1-D plume-rise model to develop a parameterization of the injection heights of North American wildfire emissions
Multi-angle Imaging SpectroRadiometer- MISR 9 view angles at Earth surface: nadir to 70.5º forward and backward 4 bands at each angle: 446,558,672, 866 nm Continuous pole-to-pole coverage on orbit dayside 400-km swath 9 day coverage at equator 2 day coverage at poles Overpass around local noon time in high and mid- latitudes 275 m - 1.1 km sampling In polar orbit aboard Terra since December 1999
Histogram of heights retrieved by MINX Cross-section of heights as a function of distance from the source MISR Plumes: MISR INteractive eXplorer (MINX) Smoke plume over central Alaska on June 2002 http://www.openchannelsoftware.org
2002 2004 2005 2006 2007 About 3500 plumes digitalized over North America http://www-misr2.jpl.nasa.gov/EPA-Plumes/
Plume Height? Leung et at, Poster B31C-0302 Stable Layer Max Boundary Layer (BL) Avg Median Each individual height Mode Plume Distribution, Atmospheric Conditions and Fire Properties Histogram of Plume Height Retrievals Atmospheric Stability Profile • Meteorological fields from GEOS-4 and GEOS-5 2x2.5 • Fire Properties from MODIS Fire Radiative Power
5-30% smoke emissions are injected above the boundary layer 2002 10–25% 2005 4–15% 2006 9–28% 2007 9–18% Val Martin et al, in preparation 2004 Kahn et al, [2008] Distribution of MISR heights-PBL for smoke plumes
Cropland Non-Boreal Grassland Boreal Grassland Non-Boreal Shrub Boreal Shrub Boreal Forest Temperate Forest Tropical Forest Classification of plume distribution by vegetation type Vegetation type based on MODIS IGBP land cover map 1x1 km resolution (http://modis-land.gsfc.nasa.gov/landcover.htm)
2002 2004 2005 2006 Number of plumes 2007 Percentage of smoke above BL varies with vegetation type and fire season % Height retrievals with [Height-PBL] > 0.5 km
Close relationship between plume distribution, fire intensity and fire size Plume Height versus Fire Size Plume Height versus Fire Intensity
200 2002 2004 2005 2006 2007 Fire intensity drives the interannual variability of plume heights Distribution of MISR heights and MODIS FRP by year
Also, fire intensity drives the seasonality of plume heights 200 Boreal Forest 2002 and 2004-2007
1-D Plume-resolving Model • Key input parameters: • Instant fire size: MODIS FRP (max FRP observed in each biome 1 km2 burned [Charles Ichoku, personal communication]) • Total heat flux: Max MODIS FRP observed over vegetation type x 10 [Wooster et al, 2005; Freeborn et al., 2008] • RH, T, P, wind speed and direction: from GEOS-4 meteo fields 2x2.5 • Fuel moisture content: from the Canadian Fire Weather Model Detailed information in Freitas et al, [2007]
Simulation of a boreal fire plume in Alaska and a grassland fire plume in Mexico 1D Plume-rise Model MISR Retrieved Heights MISR Smoke Plume Boreal Forest Fire Fire Size= 300 Ha Heat Flux= 18 kW/m2 Grassland Fire Fire Size= 3.3 Ha Heat Flux= 9 kW/m2
Simulation of a boreal fire plume in Alaska and a grassland fire plume in Mexico 1D Plume-rise Model MISR Retrieved Heights MISR Smoke Plume Boreal Forest Fire 5025 m 5425 m Fire Size= 300 Ha Heat Flux= 18 kW/m2 Grassland Fire 1200 m 900 m Fire Size= 3.3 Ha Heat Flux= 9 kW/m2
The 1-D Plume-resolving Model simulates fairly well the observed MISR heights Correlation between simulated plume heights and MISR observed heights over North America All Plumes
Concluding Remarks • 5-30% of smoke emissions are injected above the BL. • The percentage of smoke that reaches the FT depends on fire characteristics (e.g., vegetation type, fire intensity, etc) and year-to-year variations . • Fire intensity drives the seasonality and interannual variability of the plume heights. • 1-D plume-resolving model simulates fairly well the observed MISR plume heights. • In the future, we plan to embed the 1-D plume-resolving model with GEOS-Chem to simulate vertical transport of North American wildfire emissions.
The 1-D Plume-resolving Model simulates fairly well the observed MISR heights Correlation between simulated plume heights and MISR observed heights over North America Boreal Forest Plumes
The 1-D Plume-resolving Model simulates fairly well the observed MISR heights Correlation between simulated plume heights and MISR observed heights over North America Temperate Forest Plumes
Model simulated heights versus MISR observed heights by year
Model simulated heights versus MISR observed heights by vegetation
Distribution of all individual heights in the FT – Stable Layer 13% 11% 13% 24% 7% Smoke emissions tend to get confined within stable layers in the atmosphere, when they exist MISR Height – Stable Layer Height ≈ 0 km
Relationship between simulated heights and 1-D model input parameters
The 1D plume-resolving model: Governing equations dynamics thermodynamics water vapor conservation cloud water conservation rain/ice conservation bulk microphysics
Intensity of the fire drives the interannual variability of plume heights
Also, fire intensity drives the seasonality of plume heights Trop Forest
Also, fire intensity drives the seasonality of plume heights Temperate Forest
Also, fire intensity drives the seasonality of plume heights Boreal Shrub
Also, fire intensity drives the seasonality of plume heights Boreal Grassland
Also, fire intensity drives the seasonality of plume heights NonBoreal Grassland
Also, fire intensity drives the seasonality of plume heights Cropland