Download
1 / 37
370 likes | 374 Vues
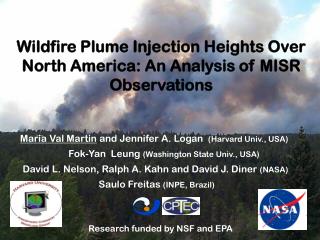
This research aims to understand the injection and plume heights of fire emissions over North America by combining MISR observations with a 1-D plume-resolving model. It provides insight into the distribution of plumes, atmospheric conditions, and fire properties. The results show a relationship between fire intensity, size, and plume heights. The 1-D model successfully simulates observed plume heights.

E N D
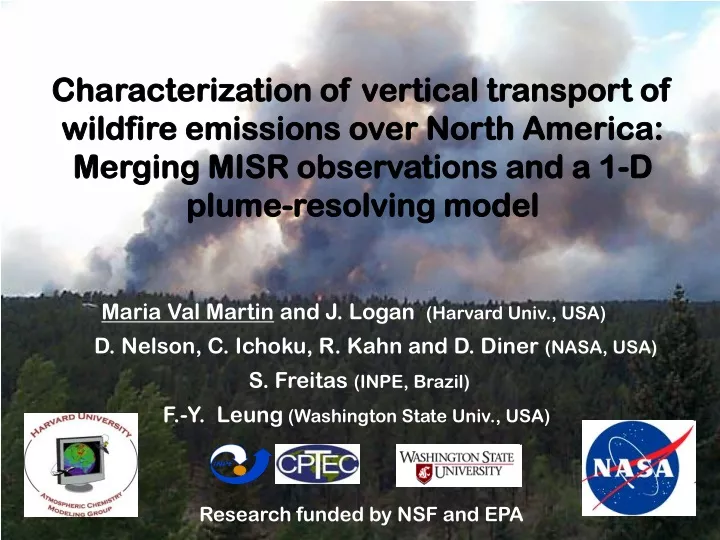
Characterization of vertical transport of wildfire emissions over North America: Merging MISR observations and a 1-D plume-resolving model Maria Val Martin and J. Logan (Harvard Univ., USA) D. Nelson, C. Ichoku, R. Kahn and D. Diner (NASA, USA) S. Freitas (INPE, Brazil) F.-Y. Leung (Washington State Univ., USA) Research funded by NSF and EPA
Hayman fire caused worst air quality ever in Denver The Hayman fire, Colorado • 56000 ha, June 8-22, 2002 • 30 miles from Denver and Colorado Springs June 8, 2002 June 9, 2002 PM10 = 40 μg/m3 PM2.5 = 10 μg/m3 PM10 = 372 μg/m3 PM2.5 = 200 μg/m3 Colorado Department of Public Health and Environment Vedal et al., Env Res, 2006
Long-range transport of boreal wildfire emissions http://asl.umbc.edu/pub/mcmillan/www/index_INTEXA.html
Scientific Objectives 1. To have a better understanding of injection heights of fire emissions over North America 2. To develop a parameterization of the injection heights of North American wildfire emissions
Scientific Objectives 1. To have a better understanding of plume heights of fire emissions over North America 2. To develop a parameterization of the injection heights of North American wildfire emissions • Outline • Overview of MISR plume data • Results from the MISR observations • Plume distribution, atmospheric conditions and fire properties • The use of 1-D plume-resolving model
Wind-corrected heights Histogram of heights retrieved by MINX Cross-section of heights as a function of distance from the source MISR Plumes: MISR INteractive eXplorer (MINX) Smoke Plume over central Alaska on June 2002 http://www.openchannelsoftware.org Courtesy of D. Nelson and D. Diner
MISR Plumes: MISR INteractive eXplorer (MINX) Smoke cloud over Yukon territory Zero-wind heights Histogram of heights retrieved by MINX Cross-section of heights as a function of distance from the source
2002 2004 2005 2006 2007 About 3500 plumes digitalized over North America http://www-misr2.jpl.nasa.gov/EPA-Plumes/
Plume Height? Stable Layer Max Boundary Layer (BL) Avg Median Each individual height Mode Plume Distribution, Atmospheric Conditions and Fire Properties Histogram of Plume Height Retrievals Atmospheric Stability Profile • Meteorological fields from GEOS-4 and GEOS-5 2x2.5 • Fire Properties from MODIS Fire Radiative Power
5-30% smoke emissions are injected above the boundary layer 2002 10–25% 2005 4–15% 2006 9–28% 2007 9–18% 2004 Kahn et al, [2008] Distribution of MISR heights-PBL for smoke plumes
Cropland Non-Boreal Grassland Boreal Grassland Non-Boreal Shrub Boreal Shrub Boreal Forest Temperate Forest Tropical Forest Classification of plume distribution by vegetation type Vegetation type based on MODIS IGBP land cover map 1x1 km resolution (http://modis-land.gsfc.nasa.gov/landcover.htm)
2002 2004 2005 2006 Number of plumes 2007 Percentage of smoke above BL varies with vegetation type and fire season % Height retrievals with [Height-PBL] > 0.5 km
A larger fraction of smoke may reach higher altitudes in the atmosphere in a later stage of the plume Smoke Plume Heights – BL 5-30% above BL Median Height: 970 m 2002-2007 Smoke Cloud Heights – BL 40-80% above BL Median Height: 1850 m
Close relationship between fire intensity, fire size, plume distribution Max Height MODIS FRP (MW) Min Height Fire Area (ha) Distribution of Max and Min heights by MODIS FRP and Fire Size Histogram of retrieved heights
200 2002 2004 2005 2006 2007 Fire intensity drives the interannual variability of plume heights Distribution of MISR heights and MODIS FRP by year
Also, fire intensity drives the seasonality of plume heights 200 Boreal Forest
200 Intensity of the fire drives also the seasonality of the plume heights NonBoreal Shrub
1-D Plume-resolving Model • Key input parameters: • Instant fire size: MODIS FRP (max FRP observed in each biome 1 km2 burned [Charles Ichoku, personal communication]) • Total heat flux: Max MODIS FRP observed over vegetation type x 10 [Wooster et al, 2005; Freeborn et al., 2008] • RH, T, P, wind speed and direction: from GEOS-4 meteo fields 2x2.5 • Fuel moisture content: from the Canadian Fire Weather Model Detailed information in Freitas et al, [2007]
Simulation of a boreal fire plume in Alaska and a grassland fire plume in Mexico 1D Plume-rise Model MISR Retrieved Heights MISR Smoke Plume Boreal Forest Fire Fire Size= 300 Ha Heat Flux= 18 kW/m2 Grassland Fire Fire Size= 3.8 Ha Heat Flux= 9 kW/m2
Simulation of a boreal fire plume in Alaska and a grassland fire plume in Mexico 1D Plume-rise Model MISR Retrieved Heights MISR Smoke Plume Boreal Forest Fire 5025 m 5425 m Fire Size= 300 Ha Heat Flux= 18 kW/m2 Grassland Fire 1200 m 900 m Fire Size= 3.3 Ha Heat Flux= 18 kW/m2
The 1-D Plume-resolving Model simulates fairly well the observed MISR heights Correlation between simulated plume heights and MISR observed heights over North America All Plumes
The 1-D Plume-resolving Model simulates fairly well the observed MISR heights Correlation between simulated plume heights and MISR observed heights over North America Boreal Forest Plumes
The 1-D Plume-resolving Model simulates fairly well the observed MISR heights Correlation between simulated plume heights and MISR observed heights over North America Temperate Forest Plumes
Concluding Remarks • 5-30% of smoke emissions are injected above the BL. • The percentage of smoke that reaches the FT depends on fire characteristics (e.g., vegetation type, fire intensity, etc) and year-to-year variations . • Fire intensity drives the seasonality and interannual variability of the plume heights. • 1-D plume-resolving model simulates fairly well the observed MISR plume heights. • In the future, we plan to embed the 1-D plume-resolving model with GEOS-Chem to simulate vertical transport of North American wildfire emissions.
Extra Slides Model simulated heights versus MISR observed heights by year
Model simulated heights versus MISR observed heights by vegetation
Intensity of the fire drives the interannual variability of plume heights
Also, fire intensity drives the seasonality of plume heights Trop Forest
Also, fire intensity drives the seasonality of plume heights Temperate Forest
Also, fire intensity drives the seasonality of plume heights Boreal Shrub
Also, fire intensity drives the seasonality of plume heights Boreal Grassland
Also, fire intensity drives the seasonality of plume heights NonBoreal Grassland
Also, fire intensity drives the seasonality of plume heights Cropland
Close relationship between fire intensity and plume distribution
Distribution of all individual heights in the FT – Stable Layer 13% 11% 13% 24% 7% Smoke emissions tend to get confined within stable layers in the atmosphere, when they exist MISR Height – Stable Layer Height ≈ 0 km
Smoke Plume Heights Median 970 m Smoke Cloud Heights Median 1850 m A larger fraction of smoke may reach higher altitudes in the atmosphere in a later stage of the plume