Download
1 / 10
100 likes | 153 Vues
Titration. What is It?. Acid and base combined together Graph of pH as a function of volume of titrant is called a titration curve. Strong Acid/Strong Base. Titration Curve. pH at the equivalence point in any titration is the pH of its resultant salt

E N D
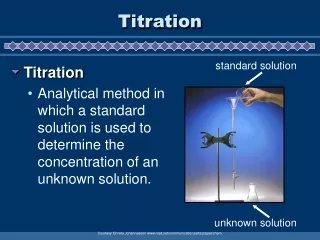
What is It? • Acid and base combined together • Graph of pH as a function of volume of titrant is called a titration curve
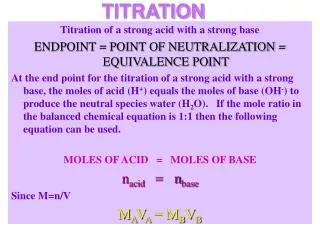
Strong Acid/Strong Base • Titration Curve
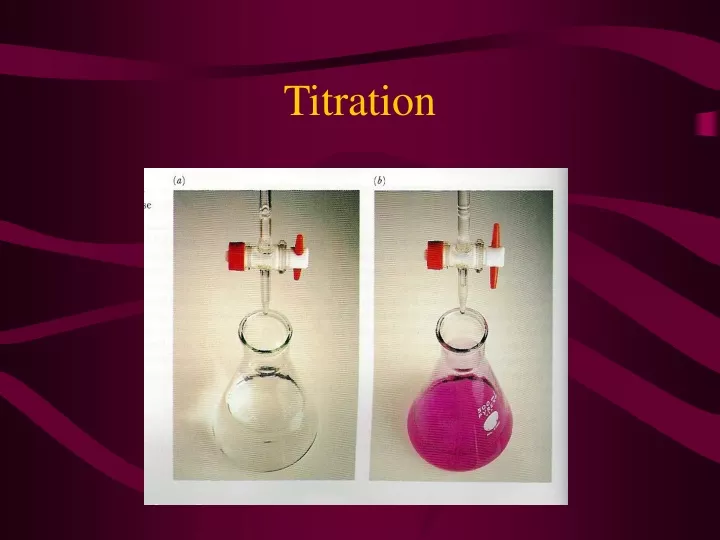
pH at the equivalence point in any titration is the pH of its resultant salt • At equivalence point there is the same amount of acid and base • No buffering occurs in strong acid and base titration • What would curve for a strong base titrated by a strong acid look like?
Example • Calculate the pH when 49.00ml of .100M NaOH is added to 50.00ml of .100M HCl.
Example • How many ml of .50 M NaOH are required to reach the equivalence point by titrating 50.0 ml of .40M HBr?
Weak Acid/Strong Base • pH starts higher • Rapid rise and then levels into a zone where pH doesn’t change much (buffering zone) • When enough base added to neutralize ½ acid – called half equivalence pt. (middle of buffer zone and pH = pKa) • pH at equivalence pt is greater than 7
Example • Calculate the pH in the titration of acetic acid by NaOH after 30.0ml of .100M NaOH is added to 50.0ml of .100M acetic acid.
Example • Draw and label a titration curve for a weak base titrated with a strong acid. Show the equivalence point, buffering zone, where pH = pK.