Download

1 / 18
190 likes | 367 Vues
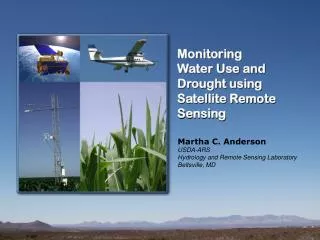
Quantitative Drought Monitoring based on Land Surface Modeling and Remote Sensing Products Eric F. Wood with Justin Sheffield, Raghuveer Vinukollu, Craig Ferguson, Kun Tao, Ming Pan, Alok Sahoo Princeton University, Princeton, New Jersey NASA Global Drought Monitoring Workshop

E N D
Quantitative Drought Monitoring based on Land Surface Modeling and Remote Sensing Products Eric F. Wood with Justin Sheffield, Raghuveer Vinukollu, Craig Ferguson, Kun Tao, Ming Pan, Alok Sahoo Princeton University, Princeton, New Jersey NASA Global Drought Monitoring Workshop Silver Spring, MD USA
Background • Drought monitoring for agriculture and water resources applications increasingly relies on remote sensing to provide large-scale, often high resolution (field scale) assessments of water availability, water use and crop productivity. • A number of remote sensing datasets are now available at large scales for all components of the water cycle, including evapotranspiration, precipitation, soil moisture and total water storage. • Importantly for drought assessment, these datasets are becoming available for several years to decades, which allows for the construction of climatologies against which current conditions can be compared.
Magnitude, M Soil Moisture Quantile, q Duration, D Time Severity, S = D x M Extent, A = area in drought PrincetonUniversity Development of a LSM-based Drought Index 1) Retrospective Simulation LSM Model Forcings Retrospective Soil Moisture 2) Calculate Drought Index: drought = run of low soil moisture Soil Moisture Percentile Drought Index Fit beta distribution 3) Drought Analysis Trends/Var Characteristics Monitoring Climate Change
Objectives/Issues • Can we detect and monitor drought events solely based on remote sensing data products available for precipitation (P), evapotranspiration (ET) and soil moisture (SM)? • It is unclear whether they are sufficiently sensitive and robust for detecting drought and its temporal and spatial characteristics. • Are these remote sensing products consistent among each other? • Whether a drought event can be detected simultaneously by all the related products? • Do these products for various water and energy components close the budget?
Approach • We evaluate the depiction of drought from remote sensing products from regional to global scales, and over multiple drought events. • These datasets are potentially well suited for quantifying vegetative and moisture stress and for understanding how drought is linked through the surface energy balance. • Comparisons are made of their ability to detect changes in stress based on drought metrics, such as percentile values, that normalize the data across space and time.
Datasets • Precipitation: TRMM TMPA / CMORPH / PERSIANN • Soil Moisture: AMSR-E • ET: Estimates using ISCCP and SRB radiation and PM, PT and SEBS Models. • NDVI: GIMMS, AVHRR • Water Storage: GRACE
AMSR-E Soil Moisture Retrievals • Retrieved globally for 2002 onwards using the Princeton Land Surface Microwave Emission Model (LSMEM). • LSMEM soil, vegetation and surface roughness parameters has been calibrated against brightness temperature using soil moisture from validated land surface model (VIC) output. Experimental retrievals over dense vegetation are obtained using estimates of vegetation optical depth derived from dual-polarized AMSR-E brightness temperatures at 10.7 GHz. AMSR-E SM VIC 10-cm SM
ET Retrievals • Evapotranspiration has been retrieved globally for 1984-2007 using three process-based models forced by two remote sensing based datasets. • The models are a modified Penman-Monteith (PM), Priestley-Taylor (PT), and the Surface Energy Balance System (SEBS). • These models are driven by radiation inputs from the ISCCP and SRB datasets, with other meteorological data from MERRA, and vegetation distribution and characteristics from MODIS and AVHRR data sets., respectively).
Other Datasets • TRMM TMPA precipitation • PERSIANN precipitation • CMORPH precipitation • GPCP precipitation • GIMMS AVHRR NDVI • GRACE Total water storage change • VIC global land surface model simulation
Consistency of Remotely Sensed Hydrological Variables PPT ET Discharge (obs, infer.) mm/day Q dS/dt These figures show the biases in remote sensing estimates of the hydrologic cycle for the Mississippi River basin (Sheffield et al., 2009) and indicate that closure cannot be achieved. Even with bias correction the remaining errors are larger than the predicted runoff as the target of closure. This may have implications for the depiction of drought.
Long-term Regional Variation in ET Products World Correlation PM-ISCCP & VIC Correlation PM-SRB & VIC Evaporation Percentiles (%) Correlation PM-SRB & PM-ISCCP --- PM-ISCCP --- VIC --- PM-SRB
Variation in SM Products over the U.S. AMSR-E retrievals monthly percentile AMSR-E daily range 2002-2008 MOSAIC LSM 10-cm monthly percentile Noah LSM 10-cm monthly percentile SAC LSM 10-cm monthly percentile VIC LSM 10-cm monthly percentile
GPCP anomaly CRU/VIC anomaly TMPA anomaly CRU/VIC temp anom GRACE anomaly VIC 10-cm SM anom VIC tot SM anom AMSR-E SM percent NDVI anomaly ET PM percentile SRB Rnet percentile ET VIC percentile Synthesis for Recent Drought Events Australia Long-term drought (shown Dec 2004 - Feb 2005) Precip/Temp Total storage/Soil Moisture NDVI/ET
GPCP anomaly CRU/VIC anomaly TMPA anomaly CRU/VIC temp anom GRACE anomaly AMSR-E SM percent VIC 10-cm SM anom VIC tot SM anom NDVI anomaly ET VIC percentile ET PM percentile SRB Rnet percentile Synthesis for Recent Drought Events USA California/Southeast 2007
GPCP anomaly CRU/VIC anomaly TMPA anomaly CRU/VIC temp anom GRACE anomaly AMSR-E SM percent VIC 10-cm SM anom VIC tot SM anom NDVI anomaly ET VIC percentile ET PM percentile SRB Rnet percentile Synthesis for Recent Drought Events Amazon Drought 2005
GPCP anomaly CRU/VIC anomaly TMPA anomaly CRU/VIC temp anom GRACE anomaly AMSR-E SM percent VIC 10-cm SM anom VIC tot SM anom NDVI anomaly ET VIC percentile ET PM percentile SRB Rnet percentile European Heat Wave 2003
Conclusions • The soil moisture data are generally able to identify dry and wet periods, and compares well to the inter-annual variability in top layer soil moisture from observation-driven land surface models (LSM). • Despite limitations due to resolution and vegetation biomass density, remote sensing based soil moisture is responsive to precipitation and can discern between wet or dry periods at monthly to seasonal time scales. • Remotely sensed ET (based on remotely sensed radiation and modeled meteorology) shows large disparities between products and with LSM data and except over humid regions. • Consistency across variables for drought monitoring still a challenge.