Download
1 / 12
120 likes | 285 Vues
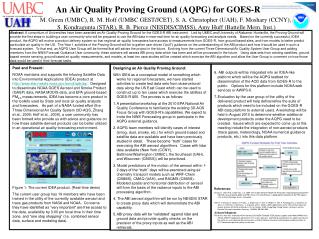
GOES-R Air Quality Proving Ground. Leads: UAH UMBC NESDIS/STAR. Air Quality Proving Ground Concept. Air Quality application team was the first team to propose this concept at the May 14 – 17, 2007 GOES-R annual meeting. Given below is an excerpt from the briefing:.

E N D
GOES-R Air Quality Proving Ground • Leads: • UAH • UMBC • NESDIS/STAR
Air Quality Proving Ground Concept • Air Quality application team was the first team to propose this concept at the May 14 – 17, 2007 GOES-R annual meeting. Given below is an excerpt from the briefing: • Interaction with users • Form user advisory group for air quality products • AQ forecasters and real time monitoring agencies • Conduct survey on data formats and visualization • Conduct survey on data priorities. For example imagery vs quantitative retrievals
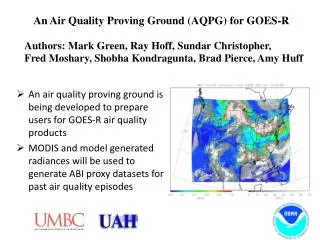
What is an Air Quality Proving Ground? • Regional test sites for which air quality issues are well understood and well known. Key pollutants are ozone and particulate matter (O3, PM2.5) • Sites need to be well instrumented for in situ, profile and column measurements • Sites need to be regionally representative of unique air quality issues (non-attainment) that GOES-R will observe in North America • Sites should all advance our ability to tie GOES-R observations to numerical prediction and surface monitoring so that regional forecasters (state and local agencies) can have a value added tool to daily prediction of tomorrow’s “Chemical Weather” Four sites are already functioning with NOAA partnership that can qualify for the proving ground concept: UMBC, CCNY, Mayaguez (PR), and UAH
End Users of the Proving Ground • Maryland Department of Environment • New York Department of Environmental Conservation • Alabama Department of Environmental Management • State and Regional Air Quality Forecasters • California Air Resource Board • Huntsville weather office • Sterling weather office • Environmental Protection Agency • USDA/USFS VIEWS/Western Governor’s Association • Academia
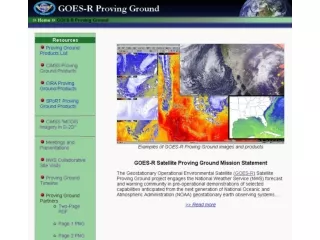
Sources of Near-Real TimeSatellite Data • MODIS daytime RGB imagery (Terra and Aqua) • OMI aerosol products • GOES-12 Imagery • GOES-12 fire and smoke products • Subjective Hazard Mapping System • Objective products determined from automated algorithms • CALIPSO (expedited quicklooks) • GOES-R* RGB Color composite imagery every 5 minutes • GOES-R * aerosol maps superimposed on visible imagery every 5 minutes * GOES-R only from AWG simulation files
Additional Satellite Productsfor comparison/interpretation • GOES fire locations • MODIS fire locations • GOES AOD maps and animations (IDEA product) • MODIS daytime aerosol maps (10 x 10km) (Terra and Aqua) • MODIS daytime AOD maps with trajectory guidance (10 x 10km) (Terra plus Aqua) from NOAA IDEA
In-situ Products • PM2.5 from AIRNow and AIRNowTech (KML maps) • AERONET AOD values (GSFC) Diagnostic Tools: • AERONET microphysical and radiative parameters (delayed until Level 2.0 processing completed) • Ground-based Lidar profiles (PBL height, backscatter) from GALION/REALM/USAQ (“Smog Blog”) • IMPROVE/Federal speciation data sets (retrospective analysis)
Predictive Models • NWS CMAQ regional forecasts • Ozone in all layers in the troposphere • PM2.5 in all layers in the troposphere • Trajectories Future as available: • CMAQ runs with assimilated satellite data • Ozone in all layers in the troposphere • PM2.5 in all layers in the troposphere
Product Delivery • Phased approach of product integration into application tools, as prioritized by end user group (see next slide), using: • AWIPS • METAR • VIS5D • McIDAS-v • Dynamic Websites? • Freeware products (Google Earth) ? Currently NWS is providing an enhanced suite of products and data in KML format. Increasing likelihood
Training/Evaluation To determine whether the End User group understands the AQ Proving Ground suite of tools, we will conduct training, evaluation and feedback sessions with the users. • Curriculum development for NOAA Air quality products (Remote Sensing courses) • ½ day and extended training sessions for end users • Evaluation/benchmarking of the value of AQ Proving Ground (I.e. do the new tools change the forecaster’s way of doing business?) • Feedback to product developers - new tools, desires?
Deliverable Proving Ground definition and kickoff meetings (0 – 3 months) Templated server applications at NESDIS (3 – 6 months) GOES-R AWG products integrated into existing suite of tools One product at a time (6 – 9 months) Demonstration to end users (one year) Redesign/documentation (two years) Conceptual timeline from start date
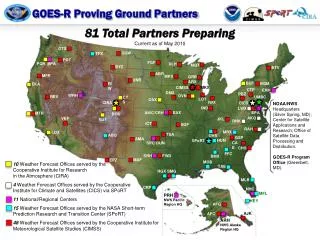
Process • UMBC will work with Sterling weather office and Maryland Department of Environment • UAH will work with Huntsville weather office and Alabama Department of Environmental Management • NESDIS/STAR provide satellite data and IDEA model runs. CMAQ regional runs available through NWS. Other CMAQ runs/experiments (data assimilation) will be made by NESDIS/STAR and UAH • UMBC, UAH, NESDIS/STAR jointly work with EPA • Other NOAA partners such as CCNY will be brought into the process after the initial phase of the AQ proving ground is rolled out