Download
1 / 65
660 likes | 801 Vues
The SDSS, The Dark Energy Survey and Large Scale Sky Surveys. Data Intensive Experimental Science James Annis Fermilab. Collaborators: in all cases, many folks. Steve Kent, Tim Mckay, Risa Weschler, Erin Sheldon, Gus Evrard, Gabriele Garzoglio, Huan Lin, Alex Szalay, Maria Nieto-Sebastian….

E N D
The SDSS, The Dark Energy Survey and Large Scale Sky Surveys Data Intensive Experimental Science James Annis Fermilab
Collaborators: in all cases, many folks Steve Kent, Tim Mckay, Risa Weschler, Erin Sheldon, Gus Evrard, Gabriele Garzoglio, Huan Lin, Alex Szalay, Maria Nieto-Sebastian… Mike Wilde, Jens Vockler, Yong Zhao, Mike Mulligan, Ian Foster, Vijay Sekhri, Neha Sharma… Brenna Flaugher, John Peoples, William Wester, Huan Lin… James Annis - Fermilab
I: Large scale sky surveys, current and planned. James Annis - Fermilab
The Scales of the Night Sky • There is only one sky and it is 41,000 sq-degrees • 100 Terabytes/sky/color • At 0.1”/pixel and 2 bytes/pixel • ~ 9 billion galaxies in the observable universe • z < 3 and L > 0.1 L* • Note the scales here: • Hundreds of thousands of images/files • Tens of Terapixels • Billion object databases 2MASS Star Map 2MASS Galaxy Map James Annis - Fermilab
CURRENT SURVEYS:The 2 Micron All Sky Survey- 2MASS • Collaboration • UMASS and NASA-IPAC • Goal • Construct modern IR imaging sky map • Classic astronomy driven • Instrumentation • 2 existing 1.3m telescopes, N+S • 2 new 0.2 Mega-pixel IR cameras • Entirely new science analysis code • Professional data factory • Status: 4 years, completed 2001 • Data • 41,000 sq-degrees, fsky = 100% • Imaging • 2” pixels, 3 infrared colors, 6 exposures • Final image 1” pixels • 0.5 TB/color • Catalogs • Point source catalog: 471 million objects • Extended source catalog: 1.6 million objects Commentary: Imaging surveys take large scale production efforts James Annis - Fermilab
Galaxy redshift map CURRENT SURVEYS:The 2dF Galaxy Redshift Survey • Collaboration: • AAT, Australian and UK Universities • Goal: • Measure the galaxy power spectra using a large redshift survey • Experiment driven • Instrumentation • Existing 3.9m telescope • New 400 fiber robot spectrograph • Status: completed 2002 • Data • 250,000 redshifts • Small data volume Commentary: Very successful at delivering targeted science on time James Annis - Fermilab
CURRENT SURVEYS:The Sloan Digital Sky Survey- SDSS • Collaboration • Fermilab, USNO, JPG, Princeton, Chicago, JHU, Washington, MPIA, Los Alamos, NMSU, … • Goal • Construct optical CCD imaging sky map • Obtain 1 million spectra • Survey driven • Instrumentation • New 2.5m telescope • New 120 Mega-pixel camera • New 600 fiber, twin dual camera spectrographs • Entirely new science analysis code • Professional data factory • Status: • completion 2005, extended to 2009? James Annis - Fermilab
CURRENT SURVEYS:SDSS Data Description and Footprint • Data • 7,000 sq-degrees, fsky = 17% • In Galactic caps • Avoids high stellar density • Avoids high extinction by dust • Imaging (in blue) • 0.4” pixels, 5 optical colors • 2% photometry • 20 repeat scans of 250 sq-degrees along fall equator • Spectra (in red) • 4096 pixels, 1A resolution • 390nm to 900 nm • spectrophotometric Commentary: Focus on survey produced extremely high quality data, but delayed science output James Annis - Fermilab
CURRENT SURVEYS:SDSS Data Releases SDSS DR1 Galaxy Map • SDSS releases data in stages, roughly a year after the spectra are taken • Early Data Release • Data Release 1, 2 • Current data release is DR3 • 5282 sq-degrees • 6 TB of images • 141 million objects • 530,00 spectra • 374,000 galaxies • 50,000 quasars • 50,000 stars • 1.2 TB of catalogs (FITS) • 2.3 TB of database (SQL) • http://www.sdss.org/dr3 SDSS DR1 Galaxy Redshift Map James Annis - Fermilab
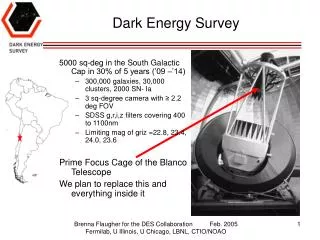
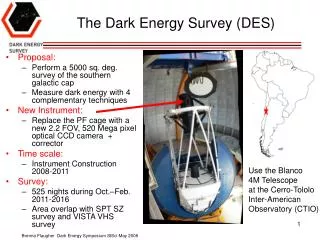
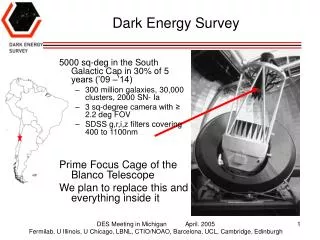
NEXT GENERATION SURVEYS:The Dark Energy Survey • Collaboration • Fermilab, UIUC, Chicago, LBNL, NOAO, NCSA • Goal • Constrain dark energy parameter w to 5% with 4 independent techniques • Experiment driven • Instrumentation • Existing 4m telescope • New 500 Mega-pixel optical camera • Professional data factory • Status: 5 years, starting in 2009 • Data • 5,000 sq-degrees, fsky = 12% • Imaging • 0.25” pixels, 4 optical colors, 5-10 exposures • Final image 0.125” pixels • ~100 TB disk, 10 PB mass storage • Catalogs • ~500 million objects James Annis - Fermilab
PAN-Stars LSST NEXT GENERATION SURVEYS:The Large Survey Telescope • Two candidates for the LST • Pan-STARRS • 2006- one 1.5m telescope, a 2 Giga-pixel camera/telescope • 4 telescope Pan-STARRS-II in 2008? • Private observatory model: • Air Force funds University of Hawaii • LSST • 2012- 6.5m telescope, 2 Giga-pixel camera • Collaboration model: • Universities, NSF, DOE, private donors • LSST Corp, NOAO, SLAC, Brookhaven, L. Livermore, … • Goal • Survey 15,000 sq-degrees every 2-3 nights for 10 years • Explore time domain for killer asteroids, kuiper belt objects, supernova, gamma ray bursts, “things that go bump in the night”. • Deep imaging for weak lensing, cluster finding, … • Survey driven • Status: Operational in 2012, if technology limited • Data • Huge data rate: 4 PB/year of images, 4 TB/year catalogs • Driven by time domain science James Annis - Fermilab
The Structure of Imaging Surveys Surveys have the scientific reach to answer big problems Experiment driven produces more focused science As a side effect, surveys provide The most high quality data To the most scientists For the lowest cost The best data come from taking the survey data seriously • The next few slides describe survey data processing James Annis - Fermilab
Imaging Survey Data Reduction • Images are the raw data • Image Processing • Corrected images are the base data • Remove CCD effects like QE variations, bias, overscan • Locate and measure point spread functions • Locate and measure objects • Astrophysical Catalog Construction • Photometric calibrations are applied • Colors and shape information heavily used to distinguish between classes. • PSF-like • Star • Quasar • Galaxy-like • Measure photometric redshift • Measure intrinsic spectral type In the SDSS, we do not make access to raw images easy. The corrected images are what the SDSS serves. The atmosphere contributes to the PSF as well as the instrument. In the SDSS we measure it spatially and temporally, and represent it using “eigen-psfs”. Optimal measurement of galaxies and stars is a rich area of algorithm development Many additional columns can be added to object catalogs. The SDSS produces catalogs of stars, quasars, high-z quasars. galaxies, main-survey galaxies, LRGs; most of these have one or more photometric redshift estimates. So here too, the raw catalogs are available, but not so easily. Calibrated, value added catalogs are served. James Annis - Fermilab
The SDSS Production System James Annis - Fermilab
Factorize pipelines Pre-jobs: data staging Jobs: main reduction step Post-jobs: quality control Chain these factors into logically higher units Bookkeeping on pipelines: Versions of pipelines Parameter files Long lived input data Older versions of data concurrent with new Fermilab-SDSS experience “In watching the Fermilab SDSS pipeline (that Steve Kent originally built) I am struck by how much they need a work flow system just to track the steps and to make sure that the quality steps are enforced. Right now much of that is `human process’.” Data derivation, data lineage, and work flow tracking are of great interest in the data factories of large scale sky surveys. Sky Survey Data Production James Annis - Fermilab
Chimera Virtual Data Language VDL Interpreter (manipulate derivations and transformations) XML Virtual Data Catalog (implements Chimera Virtual Data Schema) Chimera Virtual Data System • Chimera consists of • Virtual data catalog • Transformations, derivations, data • Virtual data language • Catalog Definitions • Query Tool • We note with interest that the same information needed for “Virtual Data” (transparency with respect to materialization) is the same that is needed for good bookkeeping. • One should be able to reproduce a given data set at any time. A “make” for data. • This information provides data tracking and result auditability. • Chimera/VDS provides workflow management that provides: • A new, structured paradigm for organizing, locating, specifying, and requesting data products • The possibility for performance optimizations, for example recreating derived data using data from a nearby archive rather than transferring it. • Places programs on same footing as data • Programs are significant community resources James Annis - Fermilab
II: The example of the Dark Energy Survey James Annis - Fermilab
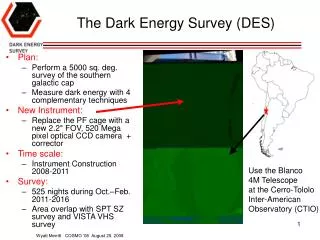
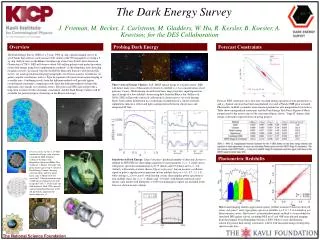
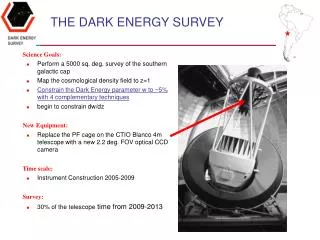
THE DARK ENERGY SURVEY Science Goals: • Perform a 5000 sq. deg. survey of the southern galactic cap • Map the cosmological density field to z=1 • Constrain the Dark Energy parameter w to ~5% with 4 complementary techniques • begin to constrain dw/dz New Equipment: • Replace the PF cage on the CTIO Blanco 4m telescope with a new 2.2 deg. FOV optical CCD camera Time scale: • Instrument Construction 2005-2009 Survey: • 30% of the telescope time from 2009-2013 James Annis - Fermilab
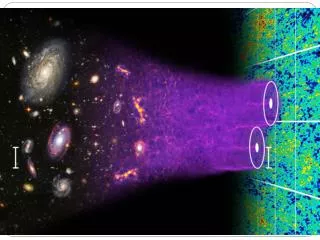
POWER SPECTRUM 70% dark energy 25% dark matter 5% baryons DARK ENERGY OBSERVATIONS:Density Fluctuation Power Spectra The energy density of the dark energy is currently best measured using mass density fluctuations, through a spatial power spectrum analysis that combines WMAP observations of the CMB with SDSS observations of the galaxy distribution. James Annis - Fermilab
DARK ENERGY OBSERVATIONS:Acceleration Discovered Using SN • Two groups discovered, independently, acceleration • Supernova Cosmology Project • High-Z Supernova Project • Acceleration is measured, whereas in power spectra techniques it is the dark energy density that is measured. • These techniques rely on type Ia supernova (white dwarf explosions) having uniform luminosities, or at least correctable to uniform. Acceleration is then the observation that distant supernovae are too dim for their redshift. James Annis - Fermilab
DARK ENERGY OBSERVATIONS:SN Can Probe Past DE Dominated Regime • Hubble Space Telescope observations can reach z > 1.0 • Dark energy becomes dominant constituent of the universe at z~0.75. • HST observations see turnover in the effect of DE on apparent brightness of supernovae. Δ Mag redshift James Annis - Fermilab
DARK ENERGY The confirmation of Dark Energy points to a major hole in our understanding of fundamental physics 95% of the Universe is in Dark Energy and Dark matter for which we have no understanding. 1998 and 2003 Science breakthroughs of the year James Annis - Fermilab
Measuring Dark Energy • One measures dark energy through how it affects the universe expansion rate, H(z): H2(z) = H20 [ M (1+z) 3 + R (1+z) 4 + DE (1+z) 3 (1+w) ] matter radiation dark energy • Note w, the parameter which describes the evolution of the density of dark energy with redshift. A cosmological constant has w = 1. wis currently constrained to ~20% by WMAP, SDSS, and supernovae • Measurements are usually integrals over H(z) r(z) = dz/H(z) • Standard Candles (e.g., supernova) measure dL(z) = (1+z) r(z) • Standard Rulers measure da(z) = (1+z)1 r(z) • Volume Markers measure dV/dzd = r2(z)/H(z) • The rate of growth of structure is a more complicated function of H(z) James Annis - Fermilab
Dark Energy using new probes Galaxy Cluster counting 20,000 clusters to z=1 with M > 2x10¹⁴ M Cluster angular power spectrum Weak lensing 300 million galaxies Photo-z accuracy of z < 0.1 to z = 1 10-20 galaxies/sq-arcminute The angular power spectra is used as a standard ruler 300 million galaxies Can be broken up into bins of photometric redshift Peak and baryon oscillation features provide ruler Dark Energy using the gold standard probe Type 1a Supernovae distances 2000 supernovae 40 sq-degrees Revisit at 3 night intervals Photo-z for all host galaxies Spectroscopic-z for ~1/4 of all host galaxies. The Dark Energy Survey 4 Key Projects James Annis - Fermilab
SURVEY DESIGN:Critical Cluster Complementarity • Combination of SPT mass measurements and DES redshifts place joint constraints on w and Wm : • Fiducial cosmology parameters from WMAP: s8=0.84, Wm=0.27, w = -1 • 29000 clusters in the 4000 deg2 DES+SPT survey area • Curvature free to vary (dashed); one sigma uncertainty on w is 0.071 • Curvature fixed @ 0 (solid); one sigma uncertainty on w is 0.04 Parameter degeneracies from different techniques are complementary DES + SPT: Majumdar & Mohr 2003 SNAP: Perlmutter & Schmidt 2003 WMAP: Spergel et al 2003 James Annis - Fermilab
Shear map(z) Galaxy map z = 3/4 z = 1/2 z = 1/4 Lensing Cosmography • The physics of weak lensing is that the intervening mass distorts the shape of background galaxies; the distortion can be described by a distortion matrix and can be measured. • The strength of weak lensing by the same foreground galaxies varies with the distance to the background galaxies. • Measure amplitude of shear vs. z • shear-galaxy correlations • shear-shear correlations • DES will • Image 5000 sq-degrees • Photo-z accuracy of z < 0.1 to z = 1 • 10-20 galaxies/sq-arcminute James Annis - Fermilab
g r i Photometric Redshifts E galaxy spectra Redshift Photometric redshifts are the key technology of the Dark Energy Survey. With them, we can pursue 4 key projects of extraordinary power. James Annis - Fermilab
Photo-z’s in the DES Photo-z of red galaxies at 0 < z < 1 left, 0.5 L* galaxies right, 2 L* galaxies Photo-z of all galaxies, red or blue, in the last magnitude shell of the DES, 23 < i < 24 blue is 1 sigma, red mean James Annis - Fermilab
INTERMEDIATE TIME SCALE South Pole Telescope SZ Survey • 10m submillimeter telescope • At the South Pole • 1000 element bolometer array • 1.25 arcminute resolution • Collaboration • John Carlstrom (Chicago) PI • Chicago, CWRU, Berkeley, Illinois and Harvard-Smithsonian CfA • Science Goals • 4000 sq-degree Sunyaev-Zeldovich effect survey • Cluster abundances and spatial power spectra • CMB polarization • NSF funded, Survey slated for 2007 SPT site SZ observations of clusters But, No redshifts! James Annis - Fermilab
III: Dark Energy Survey Survey Strategy and the SDSS Coadd James Annis - Fermilab
SURVEY DESIGN Primary Survey: • SDSS g,r,i,z :10 Limiting mag: 24.6, 24.1, 24.3, 23.9 • Survey Area 5000 sq. deg. in Southern Galactic Cap • Connection to SDSS stripe 82 for photo-z calibration • Multiple tilings (5+) in nominally 100sec units Secondary Survey: • 40 deg2 synoptic • 3 night revist scale over 4 months of survey Science Program Survey Description James Annis - Fermilab
Define a hex grid on the sky • NVO Hyperatlas standard • ISEA-6-TAN-22 • 0.25” pixels • This uses hexagons as the binning/coverage map • There are other techniques, such as Healpix, which is a nested triangle approach widely used in CMB data sets and very good for power spectra calculations. • The catalogs can be arranged this way. So can the images, which will be resampled for the DES. James Annis - Fermilab
planetary projection SPT Area Tie region SDSS Stripe 82 Albers equal area projection Covering the DES Area James Annis - Fermilab
The Tiling of the Sky is Driven by Photometry • Relative photometry • Use overlapping images of stars to place all images on same relative system. • 1000’s of stars per overlap • Precision very high, limited by systematics • Overlapping tilings • Allow reduction of systematics Recipe: • Tile the plane • Then, tile the plane with hex offset half hex over and up • This gives 30% overlap with three hexagons • Repeat, with different offsets 1 tiling 2 tilings 3 tilings James Annis - Fermilab
1 tiling 3 tilings 2 tilings How Many Tilings of the Sky • DECam is 10% sparse • 10% of each tiling is uncovered • >= 4 tilings required for every point to have 2 or more images James Annis - Fermilab
Absolute Calibration Relative Calibration Tiling Tiling s s Relative Photometry 1 N s /Sqrt(N) 0.035 2 0.018 5 0.010 -0.2 –0.20 mags to +0.20 mags Absolute Photometry –0.20 mags to +0.20 mags How Many Tilings II • Multiple tilings allow CMB techniques to average down photometric errors. • 4 tilings takes us to 0.012% relative calibration. • Choose 4 tilings as minimum James Annis - Fermilab
Solutions x = W y Simple average coadd Wcoadd = [AtA] -1At Weighted averaging W = [AtN-1A] -1AtN-1 N is the noise covariance matrix Minimum variance for Gaussian noise Provides least squares flux scalings That is, the flat map Inverting large matricies Year 1: 4 matrices of 6000x4000 Year 2: 4 matrices of 30,000x8000 CMB style mapping strategy y = A x + N y = observations Ratios of instrumental star fluxes between pairs of hexes (62 ccds = 1 hex) Includes effects of uncorrected flat field problems and scattered light problems x = scale factor map Scale factor for a given hex image N = noise A = survey mapping 0 if no overlap 1/3 if 2nd, 3rd, tiling overlap ½ if 4th, and higher tile overlaps Global Relative Photometry James Annis - Fermilab
Image Processing Images suffer from distortion and need to be rectified before they can be averaged. This is “image morphing”, with some care: Map at ½ pixel scale flux conservation (missing pixels) Increased resolution (drizzling) Interpolate mapped pixels Use windowed sinc function Lanczos: sinc(x pi)*sinc(x pi/2) Flux conservation: (kernel sums to one) Correct for change of pixel size Geometrical correction Multiply by Jacobean Flux conservation (change of pixel area) Data intensive SDSS coadd is ~15 observations of 250 sq-degrees and is a 3 TB problem (8 TB if intermediate files are saved). For DES, each tiling is 2 TB 2 tilings/year/color Year 1: 4 coadds of 4 TB each Year 2: 4 coadds of 8 TB each Input data, that is. Intermediate files will be 4x larger. Will coadd 1 years worth of DES data simulations in 2007. For the SDSS, we add ~0.5 TB per year Campaigns in spring Spring 05 Spring 06 Spring 06 The SDSS and DES Coadd James Annis - Fermilab
Coaddition Before • One can average together images taken of the same piece of sky to achieve better signal to noise, just as if one had exposed longer or went to a bigger telescope. • Average • Or sigma clip • Or median • Or variance weight • Or subspace filter • Or … • There are many varieties of averaging. After James Annis - Fermilab
Summer 04: 40,000 jobs 3 TB total input 8 TB during processing 1 TB output/coadd Depth Optimized Coadd Grid3 Custom management code Tarballs from tam01 Remote code deployment Vox/Voms VO authorization WL Optimized Coadd Qcdhome (a local cluster) 75 node, dual cpu cluster Inside Fermilab, NFS mounted data Half the input data volume March 05: Open Science Grid 40,000 jobs, 3.5 TB Virtual Data System Provenance tracking: Chimera Computation planning: Pegasus Data tracking: RLS SRM For storage allocation and transfer on the grid Built on reliable file transfer RFT, built on gsiftp Direct transfer from Grid to Fermilab mass storage Enstore: first class grid entity Data Intensive Science:Thunder Runs James Annis - Fermilab Collaboration: Huan Lin, Hubert Lampetil, Vijay Sekhri Collaboration: Huan Lin, Neha Sharma, Mike Wilde, Jens Voekler, Ian Foster, Ruth Pordes
IV:SDSS Cluster Finding James Annis - Fermilab
The MaxBcg AlgorithmCouched in Statistical Terms Catalog processing • maxBcg = “maximum liklihood brightest cluster galaxy” • In a 5 space defined by: • RA, Dec spatial • i brightness • g-r color • r-i color • Perform an adaptive grid/astrophysical trajectory computation of likelihood • Adaptive grid: ra,dec locations at galaxy positions • Astrophysical trajectory: i,g-r,r-i locations along expected apparent magnitudes and colors of a brightest cluster galaxy at all redshifts James Annis - Fermilab
Z=0.138 Z=0.041 Z=0.277 Z=0.377 SDSS Clusters James Annis - Fermilab
z = 0.06 z = 0.13 z = 0.20 Likelihood= 1.9 Likelihood= -7.8 Likelihood= -8.4 N=0 N=19 N=0 The MaxBcg AlgorithmGalaxy Cluster Finding James Annis - Fermilab
The Galaxy Number Function The output is a number function, which is compared to theoretical number functions… James Annis - Fermilab
DES Cluster Photo-z 2.5 x 10¹⁴ solar mass clusters Approximate mass limit of SPT SZ survey Optical catalogs will be complete to half this mass to z=1 1.0 x 10¹⁴ solar mass clusters DES data will enable cluster photometric redshifts with dz~0.02 for clusters out to z~1.3, for all masses relevant to the SPT Survey. James Annis - Fermilab
V:SDSS Cluster Finding as a Test Case James Annis - Fermilab
maxBCG Cluster Finding as a Test Case • We have used maxBCG over the last several years to evaluate several approaches to performing large scale, data intensive astronomy jobs. • Base rule: • Cheating is using Fermilab’s large compute farms. • Approaches • Specialized machines • Take the computers to the data • Good if you can afford it • Virtual Data on the Grid • Send the data to the computers • The Grid is currently a batch system • Running inside the SDSS database • Send the code to the data • SQL relieves one of data transport coding • Implies having large database farms at data archive centers James Annis - Fermilab
Used cluster finding as a Griphyn/iVDGL challenge problem Things to be solved VOX/VOMS/SAZ Auto-generate gridmap file for virtual organizations Remote code deploy Science code is ever changing Code deployment is just another grid job Use VDT, the Virtual Data Toolkit Ease of installation! Chimera, to track derivations Pegasus, to plan computations RLS, to track copies of the data Lessons The Grid does not like things on the scale of 100,000 Directories fill Simple databases don’t scale XML databases, for example Transferring lots of little files –vastly- inefficient, yet SDSS data is –all- little files This is a problem for mass storage as well. The Grid works the best if one treats it like a simple batch system, and don’t let the tools do to much for you. Virtual Data is a concept more suited to captive clusters and large archives then small users That was the state in late 2003-early 2004. Progress is being made quickly; it is research and development after all. Cluster Finding on the Grid James Annis - Fermilab
Cluster Finding DAG • This is the dag for 1 place on the sky. • Complicated: later stages depend on the intermediate results of nearby dags • A real analysis, not constructed to be bad. James Annis - Fermilab