Download
1 / 1
10 likes | 121 Vues
The Dark Energy Survey J. Frieman, M. Becker, J. Carlstrom, M. Gladders, W. Hu, R. Kessler, B. Koester, A. Kravtsov, for the DES Collaboration. Overview. Probing Dark Energy. Forecast Constraints.

E N D
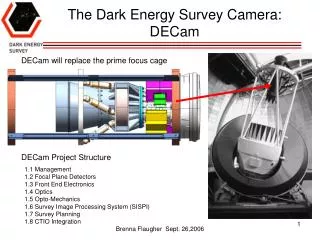
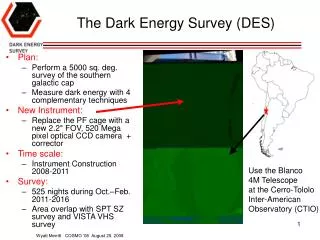
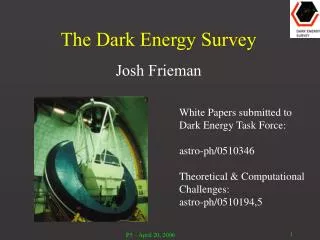
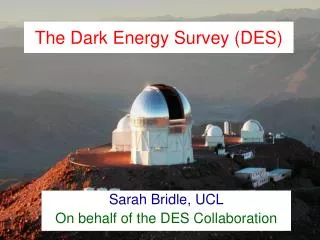
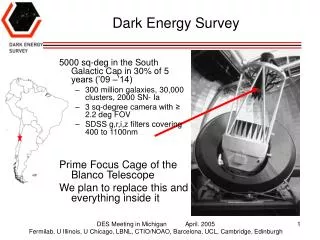
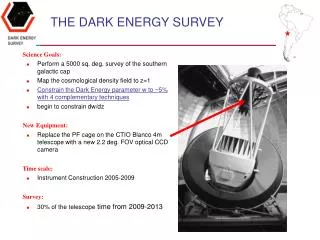
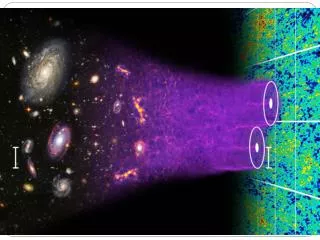
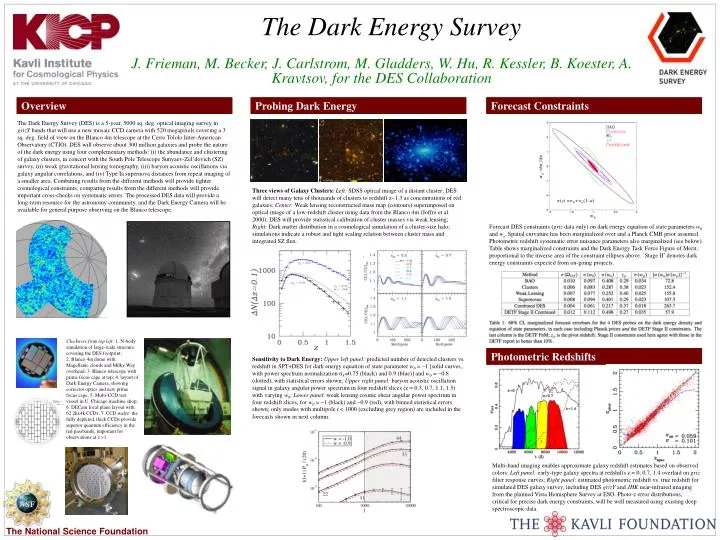
The Dark Energy Survey J. Frieman, M. Becker, J. Carlstrom, M. Gladders, W. Hu, R. Kessler, B. Koester, A. Kravtsov, for the DES Collaboration Overview Probing Dark Energy Forecast Constraints The Dark Energy Survey (DES) is a 5-year, 5000 sq. deg. optical imaging survey in grizY bands that will use a new mosaic CCD camera with 520 megapixels covering a 3 sq. deg. field of view on the Blanco 4m telescope at the Cerro Tololo Inter-American Observatory (CTIO). DES will observe about 300 million galaxies and probe the nature of the dark energy using four complementary methods: (i) the abundance and clustering of galaxy clusters, in concert with the South Pole Telescope Sunyaev-Zel’dovich (SZ) survey, (ii) weak gravitational lensing tomography, (iii) baryon acoustic oscillations via galaxy angular correlations, and (iv) Type Ia supernova distances from repeat imaging of a smaller area. Combining results from the different methods will provide tighter cosmological constraints; comparing results from the different methods will provide important cross-checks on systematic errors. The processed DES data will provide a long-term resource for the astronomy community, and the Dark Energy Camera will be available for general purpose observing on the Blanco telescope. Three views of Galaxy Clusters:Left: SDSS optical image of a distant cluster; DES will detect many tens of thousands of clusters to redshift z~1.3 as concentrations of red galaxies; Center: Weak lensing reconstructed mass map (contours) superimposed on optical image of a low-redshift cluster using data from the Blanco 4m (Joffre et al. 2000); DES will provide statistical calibration of cluster masses via weak lensing; Right: Dark matter distribution in a cosmological simulation of a cluster-size halo; simulations indicate a robust and tight scaling relation between cluster mass and integrated SZ flux. w(z) =w0+wa(1–a) Forecast DES constraints (griz data only) on dark energy equation of state parameters w0 and wa.Spatial curvature has been marginalized over and a Planck CMB prior assumed. Photometric redshift systematic error nuisance parameters also marginalized (see below). Table shows marginalized constraints and the Dark Energy Task Force Figure of Merit, proportional to the inverse area of the constraint ellipses above. `Stage II’ denotes dark energy constraints expected from on-going projects. Clockwise from top left: 1. N-body simulation of large-scale structure covering the DES footprint; 2. Blanco 4m dome with Magellanic clouds and Milky Way overhead; 3. Blanco telescope with prime focus cage at top; 4. layout of Dark Energy Camera, showing corrector optics and new prime focus cage; 5. Multi-CCD test vessel in U. Chicago machine shop; 6. DECam focal plane layout with 62 2kx4k CCDs; 7. CCD wafer: the fully depleted, thick CCDs provide superior quantum efficiency in the red passbands, important for observations at z 1. Photometric Redshifts Sensitivity to Dark Energy:Upper left panel: predicted number of detected clusters vs. redshift in SPT+DES for dark energy equation of state parameter w0 = 1 [solid curves, with power spectrum normalization 8=0.75 (black) and 0.9 (blue)] and w0 = 0.8 (dotted), with statistical errors shown; Upper right panel: baryon acoustic oscillation signal in galaxy angular power spectrum in four redshift slices (z = 0.3, 0.7, 1.1, 1.5) with varying w0; Lower panel: weak lensing cosmic shear angular power spectrum in four redshift slices, for w0 = 1 (black) and 0.9 (red), with binned statistical errors shown; only modes with multipole l < 1000 (excluding grey region) are included in the forecasts shown in next column. Multi-band imaging enables approximate galaxy redshift estimates based on observed colors: Left panel: early-type galaxy spectra at redshifts z = 0, 0.7, 1.4 overlaid on griz filter response curves; Right panel: estimated photometric redshift vs. true redshift for simulated DES galaxy survey, including DES grizY and JHK near-infrared imaging from the planned Vista Hemisphere Survey at ESO. Photo-z error distributions, critical for precise dark energy constraints, will be well measured using existing deep spectroscopic data.