Download
1 / 34
340 likes | 417 Vues
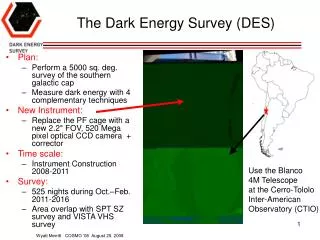
Dark Energy in the Supernova Legacy Survey. Mark Sullivan (University of Toronto). http://legacy.astro.utoronto.ca/. Victoria Group Chris Pritchet, Don Neill, Dave Balam. French Group Reynald Pain (PI), Pierre Astier, Julien Guy, Nicolas Regnault, Jim Rich, Stephane Basa, Dominique Fouchez.

E N D
Dark Energy in the Supernova Legacy Survey Mark Sullivan (University of Toronto) http://legacy.astro.utoronto.ca/
Victoria Group Chris Pritchet, Don Neill, Dave Balam French Group Reynald Pain (PI), Pierre Astier, Julien Guy, Nicolas Regnault, Jim Rich, Stephane Basa, Dominique Fouchez Toronto Group Ray Carlberg, Mark Sullivan, Andy Howell, Kathy Perrett, Alex Conley UK Gemini PI: Isobel Hook USA LBL: Saul Perlmutter CIT: Richard Ellis Plus: Many students and associate members throughout the world
SNLS: Vital Statistics • 202n/5 year rolling SN survey • Uses “Megacam” 36CCD 1 sq. deg. imager on the CFHT • Observe in griz every 4th night in Grey/Dark time • Typical seeing: 0.5-0.6 arcsec • Depth i’>24.5 (S/N=8) in 1 hr • 4 survey fields; 2 always available: Queue scheduling – and the highest queue priority – offers protection from weather
Organisation • SNLScollaboration • Data-processing • Major Spectroscopic Program • Gemini (Canada/UK/USA) • 120 hrs/yr (60:40:20) • VLT (France/Other Euros) • 120 hrs/yr • Keck (through LBL) • 40 hrs/yr • Cosmological analyses • Magellan near-IR study (Freedman et al.) • Rest-frame I-band Hubble diagram • Keck SN Ia UV study (Ellis/Sullivan et al.) • LRIS high-S/N - metallicity through UV lines • Testing accuracy of k-corrections in the UV • SN IIP study (Nugent/Sullivan/Ellis et al.) • Using SNe IIP as standard candles • Independent Hubble diagram to z=0.5
Current Status • Survey has now been running for 3 years • Nearly 300 spectroscopically confirmed SNe Ia • “On track” for 500 by survey end
Redshift distribution Redshift range: 0.08<z<1.06
Typical light-curves z = 0.36 Rolling search: Lightcurves are equally well-sampled at all phases z = 0.91
First-Year SNLS Hubble Diagram First Year Results (Astier et al. 2006) Assuming flatness, w=-1: ΩM = 0.263 ± 0.042 Intrinsic disp.: 0.13 ± 0.02 Low-z: 0.15 ±0.02 SNLS: 0.12 ± 0.02
Dark energy: SNLS + BAO Assuming flatness: ΩM = 0.271 ± 0.021 w=-1.023 ± 0.087
Dark energy: SNLS + WMAP Spergel et al. (2006)
Coming soon… • The first year SNLS dataset provides the best SN sample for measuring “w” • This sample is only 10-15% of the final sample • Third Year cosmological analysis: • Data collection complete in 2 months • SN sample 4-5 times larger • Improved “z” data will make the higher-redshift SNe more cosmologically powerful than in Year 1 • Results should be ready in the Fall
Current status – and where next? • First year: • N~70; w=-1.02 • w: ±0.09 (stat) (RED) • w: ±0.055 (sys) (BLUE) • Third Year: • N~250-300 • End-of-survey: • N~500-600 • ±~0.05 (stat) • ±??? (sys) Substantial effort needs to be invested not only in “N”, but in reducing systematics
Potential Systematics in measuring w More “mundane” • Photometric zeropoints • Mismatches to local SNe observations • Contamination by non-SNe Ia • Spectroscopy is critical • K-corrections • U and near-UV uncertain - see poster 13.04 by Eric Hsiao • Extinction • Effective RB;Dust evolution; Grey dust • Redshift evolution in the mix of SNe • “Population drift” • Evolution in SN properties • Light-curves/Colors/Luminosities More “scientifically interesting”
White Dwarf ? • Many competing models for: • Nature of progenitor system – the “second star” • Single versus double degenerate • Young versus old progenitor • Explosion mechanism? • Mass transfer mechanism?
SNLS work on understanding SNe Ia • Relationship with environment (Sullivan et al. 2006) • SN explode in galaxies with different ages/metallicities • Population “drift”? – galaxy mix evolves with redshift • Evolution in SN properties • Rise-time analysis (Conley et al. 2006) • High signal/noise UV spectroscopy (Ellis/Sullivan et al.) • Progenitor metallicity mostly affects the UV – Evolution? • Improved U-band k-corrections
Conley et al. 2006, AJ, submitted tr: rise time Evolution in Ia properties with z? Riess et al. 1999 rise time of low-z and high-z SNe different by 5.8. Limitations: • Inhomogeneous data • No early-time data Conley et al. find low-z and high-z SNLS risetimes consistent at 1
Optical Typing of SNe Ia hosts • CFHT u*g’r’i’z’ imaging via the Legacy program. (UofT seeing limit stacks) • PEGASE2 is used to fit SED templates to the optical data. • Recent star-formation rate, and total stellar mass are estimated. • Sources classified based on their specific star-formation rate. Passive Star-forming Starbursting
SNLS: SN rate as a function of sSFR 125 Host Galaxies at z<0.75 Use specific star-formation rate (SFR per unit mass) to classify the SNLS SNIa hosts Per unit stellar mass, SNe are at least an order of magnitude more common in more vigorously star-forming galaxies SNLS “passive” galaxies Low-redshift data from Mannucci et al. 2005
“A+B” Model • Scannapieco & Bildsten (2005) and Mannucci et al. (2005): Two component model • Prompt: P=B @ t=0 and P=0 at all other times • Delayed: P=A constant with time
“Prompt” “Delayed” Mannucci et al. 2006 – P(t) “A+B” essentially approximates the details of the SNIa delay-time probability distribution
“A+B” total “A” component Mix will evolve with redshift… Relative mix evolves strongly with redshift Neill et al. (2006) SNLS SNIa rate “B” component
Light-curve width / host-type • Light-curvewidth is a key parameter for standardizing SNe Ia as calibrateable candles • We use the “stretch” technique (e.g. Perlmutter et al. 1997) • Stretch is known to depend on environment locally: • e.g. Riess et al. (1999), Hamuy et al. (1995;2000)
Stretch/Environment Stretch Fainter SNe Brighter SNe
Further evidence for A+B? Star-forming galaxies plus “mass-scaled” passive All star-forming galaxies MINUS passive All star-forming galaxies
Other environmental differences? (Conley et al. 2006, AJ submitted) No evidence for gross differences between light-curves in passive and active galaxies
Cosmological effects? “First-year” SNLS dataset plus low-z classified by morphology Black–passive Red– active More to come in the third year analyses…
Lentz et al. (2000) Varying metallicity changes line blanketing in the UV Spectral UV evolution studies • Possible metallicity clues in the far-UV spectrum • Address concerns over systematics? • Little is known in the UV at z=0 • Atmosphere precludes observations • Space-based time is hard to come by • Try at intermediate redshift – where a guaranteed supply of SNe (SNLS) removes scheduling problems • Keck-I/LRIS campaign (PI: Ellis) using LRIS-B • ~25 high-quality (S/N) spectra down to rest-frame 2800A
Mean z=0.5 UV spectrum Ellis, Sullivan et al. Preliminary
Summary • SNLS is a mature survey – 8-10 new SNe Ia confirmed every month • With nearly 300 SNe Ia in hand, the survey will have around 500 by the scheduled finish in 2008 • 1st year SNLS dataset is the most uniform, well understood, and statistically powerful SN Ia data set • SNLS data is currently the best SN Ia dataset to combine with either BAO or WMAP data to measure dark energy.
Summary • The challenge now is the control of systematics: • SNe Ia know and “care” about their environment • Light-curve width depends on age of the progenitor population • Evidence for wide-range of delay-times, or two progenitors – relative mix evolves with redshift? • The final SNLS data set will be essential for constraining systematics for next generation projects like the LSST or NASA’s JDEM.