Download
1 / 37
370 likes | 581 Vues
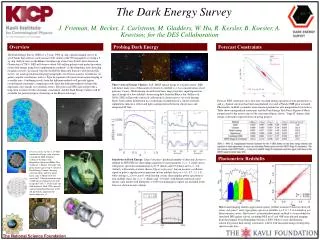
The Dark Energy Survey. White Papers submitted to Dark Energy Task Force: astro-ph/0510346 Theoretical & Computational Challenges: astro-ph/0510194,5. Josh Frieman. The Dark Energy Survey. Blanco 4-meter at CTIO. Study Dark Energy using 4 complementary* techniques:

E N D
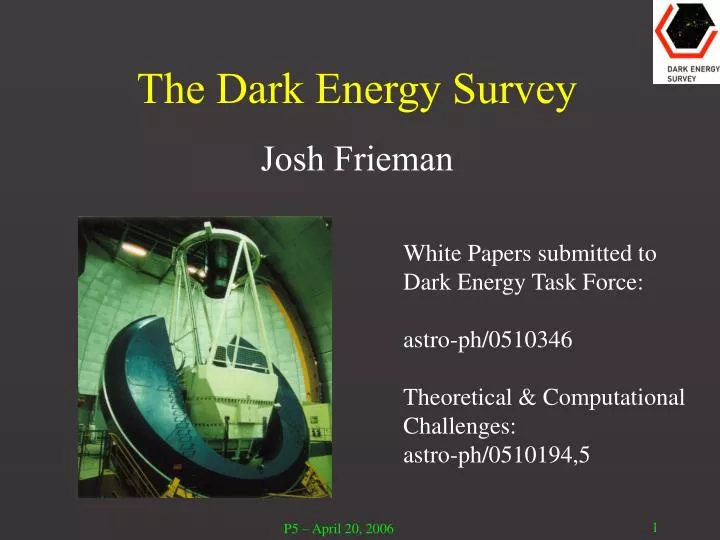
The Dark Energy Survey White Papers submitted to Dark Energy Task Force: astro-ph/0510346 Theoretical & Computational Challenges: astro-ph/0510194,5 Josh Frieman
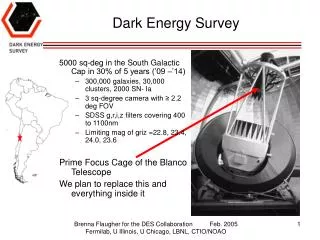
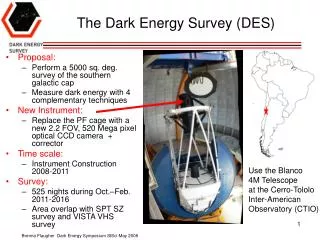
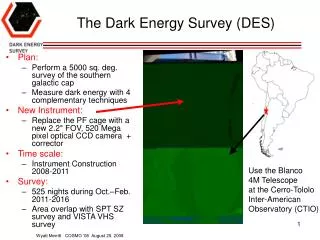
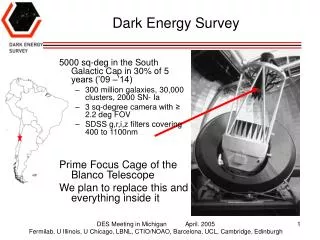
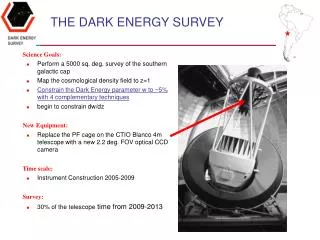
The Dark Energy Survey Blanco 4-meter at CTIO • Study Dark Energy using 4 complementary* techniques: I. Cluster Counts II. Weak Lensing III. Baryon Acoustic Oscillations IV. Supernovae • Two multiband surveys: 5000 deg2g, r, i, z 40 deg2 repeat (SNe) • Build new 3 deg2 camera and Data management sytem Survey 2009-2015 (525 nights) Response to NOAO AO *in systematics & in cosmological parameter degeneracies *geometric+structure growth: test Dark Energy vs. Gravity
The DES Collaboration Fermilab:J. Annis, H. T. Diehl, S. Dodelson, J. Estrada, B. Flaugher, J. Frieman, S. Kent, H. Lin, P. Limon, K. W. Merritt, J. Peoples, V. Scarpine, A. Stebbins, C. Stoughton, D. Tucker, W. Wester University of Illinois at Urbana-Champaign:C. Beldica, R. Brunner, I. Karliner, J. Mohr, R. Plante, P. Ricker, M. Selen, J. Thaler University of Chicago:J. Carlstrom, S. Dodelson, J. Frieman, M. Gladders, W. Hu, S. Kent, R. Kessler, E. Sheldon, R. Wechsler Lawrence Berkeley National Lab:N. Roe, C. Bebek, M. Levi, S. Perlmutter University of Michigan:R. Bernstein, B. Bigelow, M. Campbell, D. Gerdes, A. Evrard, W. Lorenzon, T. McKay, M. Schubnell, G. Tarle, M. Tecchio NOAO/CTIO:T. Abbott, C. Miller, C. Smith, N. Suntzeff, A. Walker CSIC/Institut d'Estudis Espacials de Catalunya (Barcelona):F. Castander, P. Fosalba, E. Gaztañaga, J. Miralda-Escude Institut de Fisica d'Altes Energies (Barcelona):E. Fernández, M. Martínez CIEMAT (Madrid): C. Mana, M. Molla, E. Sanchez, J. Garcia-Bellido University College London:O. Lahav, D. Brooks, P. Doel, M. Barlow, S. Bridle, S. Viti, J. Weller University of Cambridge:G. Efstathiou, R. McMahon, W. Sutherland University of Edinburgh:J. Peacock University of Portsmouth: R. Crittenden, R. Nichol, W. Percival University of Sussex: A. Liddle, K. Romer plus students
Photometric Redshifts Elliptical galaxy spectrum • Measure relative flux in four filters griz: track the 4000 A break • Estimate individual galaxy redshifts with accuracy (z) < 0.1 (~0.02 for clusters) • Precision is sufficient for Dark Energy probes, provided error distributions well measured. • Note: good detector response in z band filter needed to reach z>1
Galaxy Photo-z Simulations DES griz filters +VDES JK DES DES + VDES on ESO VISTA 4-m enhances science reach 10 Limiting Magnitudes g 24.6 r 24.1 i 24.0 z 23.9 +2% photometric calibration error added in quadrature Key: Photo-z systematic errors under control using existing spectroscopic training sets to DES photometric depth Cunha, etal Improved Photo-z & Error Estimates and robust methods of outlier rejection
I. Clusters and Dark Energy Number of clusters above observable mass threshold • Requirements • Understand formation of dark matter halos • Cleanly select massive dark matter halos (galaxy clusters) over a range of redshifts • Redshift estimates for each cluster • Observable proxy that can be used as cluster mass estimate: O =g(M) Primary systematic: Uncertainty in bias & scatter of mass-observable relation Dark Energy equation of state Volume Growth (geometry) Mohr
3 Techniques for Cluster Selection and Mass Estimation: Optical galaxy concentration Weak Lensing Sunyaev-Zel’dovich effect (SZE) Cross-compare these techniques to reduce systematic errors Additional cross-checks: shape of mass function; cluster correlations Cluster Cosmology with DES
10-m South Pole Telescope (SPT) • Sunyaev-Zel’dovich effect • Compton upscattering of CMB photons • by hot gas in clusters • - nearly independent of redshift: • - can probe to high redshift • - need ancillary redshift measurement SPT will carry out 4000 sq. deg. SZE Survey PI: J. Carlstrom (U. Chicago) Dec 2005 NSF-OPP funded & scheduled for Nov 2006 deployment DOE (LBNL) funding of readout development
SZE vs. Cluster Mass: Progress in Realistic Simulations Adiabatic ∆ Cooling+Star Formation SZE flux small (~10%) scatter SPT Observable Kravtsov Future: SCIDAC proposal Nagai Integrated SZE flux decrement depends only on cluster mass: insensitive to details of gas dynamics/galaxy formation in the cluster core robust scaling relations Motl, etal
Statistical Weak Lensing Calibrates Cluster Mass vs. Observable Relation Cluster Mass vs. Number of galaxies they contain For DES, will use this to independently calibrate SZE vs. Mass SDSS Data Preliminary z<0.3 Statistical Lensing eliminates projection effects of individual cluster mass estimates Johnston, etal astro-ph/0507467 Johnston, Sheldon, etal, in preparation
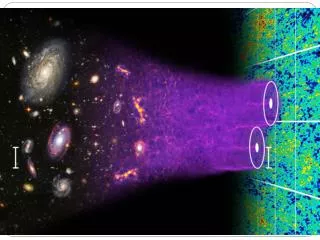
Background sources Dark matter halos Observer • Statistical measure of shear pattern, ~1% distortion • Radial distances depend on geometry of Universe • Foreground mass distribution depends on growth of structure
Weak Lensing Tomography • Cosmic Shear Angular Power Spectrum in 4 Photo-z Slices • Shapes of ~300 million galaxies median redshift z = 0.7 • Primary Systematics: photo-z’s, PSF anisotropy, shear calibration Statistical errors shown Huterer DES WL forecasts conservatively assume 0.9” PSF = median delivered to existing Blanco camera: DES should do better & be more stable (see Brenna’s talk)
Reducing WL Shear Systematics Cosmic Shear (signal) Results from 75 sq. deg. WL Survey with Mosaic II and BTC on the Blanco 4-m Bernstein, etal DES: comparable depth: source galaxies well resolved & bright: low-risk (old systematic) (improved systematic) Red: expected signal See Brenna’s talk for DECam+Blanco hardware improvements that will reduce raw lensing systematics Shear systematics under control at level needed for DES
III. Baryon Acoustic Oscillations (BAO) in the CMB • Characteristic angular scale set by sound horizon at recombination: standard ruler (geometric probe).
Baryon Acoustic Oscillations: CMB & Galaxies Acoustic series in P(k) becomes a single peak in (r) CMB Angular Power Spectrum SDSS galaxy correlation function Bennett, etal Eisenstein etal
BAO in DES: Galaxy Angular Power Spectrum Wiggles due to BAO Probe substantially larger volume and redshift range than SDSS Fosalba & Gaztanaga Blake & Bridle
IV. Supernovae • Geometric Probe of Dark Energy • Repeat observations of 40 deg2 , using 10% of survey time • ~1900 well-measured SN Ia lightcurves, 0.25 < z < 0.75 • Larger sample, improved z-band response compared to ESSENCE, SNLS; address issues they raise • Improved photometric precision via in-situ photometric response measurements SDSS
Assumptions: Clusters: 8=0.75, zmax=1.5, WL mass calibration (no clustering) BAO:lmax=300 WL:lmax=1000 (no bispectrum) Statistical+photo-z systematic errors only Spatial curvature, galaxy bias marginalized Planck CMB prior w(z) =w0+wa(1–a) 68% CL DES Forecasts: Power of Multiple Techniques geometric+ growth Clusters if 8=0.9 geometric Ma, Weller, Huterer, etal
DES and a Dark Energy Program • Will measure Dark Energy using multiple complementary probes, developing these techniques and exploring their systematic error floors • Survey strategy delivers substantial DE science after 2 years • Relatively modest, low-risk, near-term project with high discovery potential • Scientific and technical precursor to the more ambitious Stage IV Dark Energy projects to follow: LSST and JDEM • DES in unique international position to synergize with SPT and VISTA on the DETF Stage III timescale (PanSTARRS is in the Northern hemisphere; cannot be done with existing facilities in the South)
Spectroscopic Redshift Training Sets for DES Training Sets to the DES photometric depth in place (advantage of a `relatively’ shallow survey)
DES Cluster Photometric Redshift Simulations DES: for clusters, (z) < 0.02 for z <1.3 DES+VDES griz+JK on VISTA: extend photo-z’s to z~2 (enhances, but not critical to, science goals)
Variance and Bias of Photo-z Estimates Bias Variance Cunha etal
Robustly Reducing Catastrophic Errors Original 10% Cut Remove 10% of objects via color cuts 30% improvement
Weak Lensing & Photo-z Systematics (w0)/(w0|pz fixed) (wa)/(wa|pz fixed) Ma
BAO & Photo-z Systematics (w0)/(w0|pz fixed) (wa)/(wa|pz fixed) Ma
Supernovae and photo-z errors Huterer
Whisker plots for three BTC camera exposures; ~10% ellipticity Left and right are most extreme variations, middle is more typical. Correlated variation in the different exposures: PCA analysis --> can use stars in all the images: much better PSF interpolation Improving Corrections for Anisotropic PSF Focus too low Focus (roughly) correct Focus too high Jarvis and Jain
Remaining ellipticities are essentially uncorrelated. Measurement error is the cause of the residual shapes. 1st improvement: higher order polynomial means PSF accurate to smaller scales 2nd: Much lower correlated residuals on all scales PCA Analysis Focus (roughly) correct Focus too high Focus too low
Lensing Cluster Source Image Tangential shear
Statistical Weak Lensing by Galaxy Clusters Mean Tangential Shear Profile in Optical Richness (Ngal) Bins to 30 h-1Mpc Sheldon, Johnston, etal SDSS preliminary
Invert Mean Shear Profile to obtain Mean Mass Profile Virial Mass Johnston, Sheldon, etal SDSS preliminary Virial radius
Requirements Understand formation of dark matter halos Cleanly select massive dark matter halos (galaxy clusters) over a range of redshifts Redshift estimates for each cluster Observable proxy that can be used as cluster mass estimate: O =g(M) Primary systematic: Uncertainty in bias & scatter of mass-observable relation Sensitivity to Mass Threshold Precision Cosmology with Clusters Mass threshold
(DE) (w) Forecasts for Constant w Models
Forecasts with WMAP Priors (w0) (wa)