Download

1 / 58
580 likes | 738 Vues
DARK ENERGY SURVEY (DES). Francisco Javier Castander Serentill. IEEC/CSIC. All material borrowed from DES collaboration. Announcement of Opportunity Blanco Instrumentation Partnership. Develop a major instrument for Blanco 4m CTIO Submit a science, technical & management plan

E N D
DARK ENERGY SURVEY (DES) Francisco Javier Castander Serentill IEEC/CSIC All material borrowed from DES collaboration
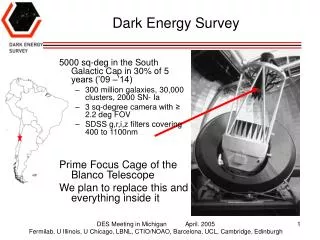
Announcement of Opportunity Blanco Instrumentation Partnership • Develop a major instrument for Blanco 4m CTIO • Submit a science, technical & management plan • Community instrument • Up to 30% of Blanco 4m for 5 years commencing in 2007 or 2008 • Letter of intent March 15, 2004 • Proposals August 15 2004
The Science Case for the Dark Energy Survey James Annis For the DES Collaboration
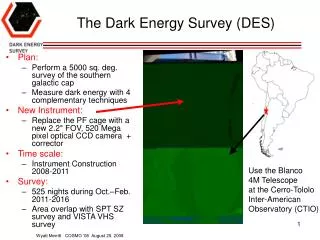
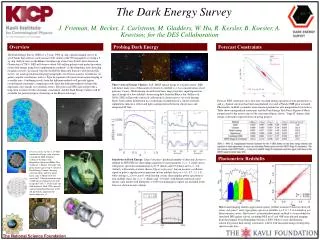
We propose to make precision measurements of Dark Energy Cluster counting, weak lensing and supernovae Independent measurements by mapping the cosmological density field to z=1 Measuring 300 million galaxies Spread over 5000 sq-degrees using new instrumentation of our own design. 500 Megapixel camera 2.1 degree field of view corrector Install on the existing CTIO 4m The Dark Energy Survey
Cosmology in 2004 Sloan Digital Sky Survey measures the galaxy density field at z < 0.3 WMAP measures the CMB radiation density field at z=1000 • Combine to measure parameters of cosmology to 10%. • We enter the era of precision cosmology. • Confirms dark energy (!) 2003 Science breakthrough of the year
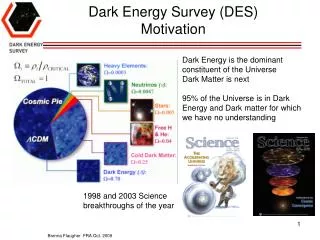
Dark energy? Who ordered that? (said Rabi about muons) Dark energy is the dominant constituent of the Universe Dark matter is next The Big Problems: Dark Energy and Dark Matter The confirmation of Dark Energy points to major holes in our understanding of fundamental physics 95% of the Universe is in forms unknown to us 1998 Science breakthrough of the year
Dark Energy • The Cosmological Constant Problem Particle physics theory currently provides no understanding of why the vacuum energy density is so small: DE(Theory) /DE(obs) = 10120 • The Cosmic Coincidence Problem Theory provides no understanding of why the Dark Energy density is just now comparable to the matter density. • What is it? Is dark energy the vacuum energy? a new, ultra-light particle? a breakdown of General Relativity on large scales? Evidence for extra dimensions? The nature of the Dark Energy is one of the outstandingunsolved problems of fundamental physics. Progress requires more precise probes of Dark Energy.
Measuring Dark Energy • One measures dark energy through how it affects the universe expansion rate, H(z): H2(z) = H20 [ M (1+z) 3 + R (1+z) 4 + DE (1+z) 3 (1+w) ] matter radiation dark energy • Note the parameter w, which describes the evolution of the density of dark energy with redshift. A cosmological constant has w = 1. w is currently constrained to ~20% by WMAP, SDSS, and supernovae • Measurements are usually integrals over H(z) r(z) = dz/H(z) • Standard Candles (e.g., supernova) measure dL(z) = (1+z) r(z) • Standard Rulers measure da(z) = (1+z)1 r(z) • Volume Markers measure dV/dzd = r2(z)/H(z) • The rate of growth of structure is a more complicated function of H(z)
DES Dark Energy Measurements • New Probes of Dark Energy • Galaxy Cluster counting • 20,000 clusters to z=1 with M > 2x10¹⁴ M • Weak lensing • 300 million galaxies with shape measurements • Spatial clustering of galaxies • 300 million galaxies • Standard Probes of Dark Energy • Type 1a Supernovae distances • 2000 supernovae
Type 1a Supernovae magnitudes and redshifts provide a direct means to probe dark energy Standard candles DES will make the next logical step in this program: Image 40 sq-degree repeatedly 2000 supernovae at z < 0.8 Well measured light curves 2005 2010 2020 2000 2015 Supernova Current projects Essence CFHLS SCP SDSS PanStarrs LSST SNAP Proposed projects DES
Rely on mapping the cosmological density field Up to the decoupling of the radiation, the evolution depends on the interactions of the matter and radiation fields - ‘CMB physics’ After decoupling, the evolution depends only on the cosmology - ‘large-scale structure in the linear regime’. Eventually the evolution becomes non-linear and complex structures like galaxies and clusters form - ‘non-linear structure formation’. New Probes of Dark Energy z = 0 z = 30
Planck LSST SNAP SDSS WMAP 2005 2010 2020 2000 2015 DES Spatial Clustering of Galaxies • The distribution of galaxy positions on the sky reflects the initial positions of the mass • Maps of galaxy positions are broken up in photometric redshift bins • The spatial power spectrum is computed and compared with the CMB fiducial power spectrum. • The peak and the baryon oscillations provide standard rulers. • DES will • Image 5000 sq-degrees • Photo-z accuracy of z < 0.1 to z = 1 • 300 million galaxies PanStarrs Cooray, Hu, Huterer, Joffre 2001
Weak lensing is the statistical measurement of shear due to foreground masses A shear map is a map of the shapes of background galaxies Dls distance from lens to source Background galaxy shear maps Lensing galaxies Dl distance to lens Light path Ds distance to source Weak Lensing
The strength of weak lensing by the same foreground galaxies varies with the distance to the background galaxies. Measure amplitude of shear vs. z shear-galaxy correlations shear-shear correlations DES will Image 5000 sq-degrees Photo-z accuracy of z < 0.1 to z = 1 10-20 galaxies/sq-arcminute Shear maps(z) Galaxy map z = 3/4 z = 1/2 z = 1/4 Planck LSST SNAP SDSS WMAP 2005 2010 2020 2000 2015 DES Weak Lensing PanStarrs DeepLens CFHLS
Clusters of galaxies are peaks of the density field. Dark energy influences the number and distribution of clusters and how they evolve with time. Peaks in the Density Field 16 Mpc 2 Mpc
Our mass estimators Galaxy count/luminosity Weak lensing Sunyaev-Zeldovich The South Pole Telescope project of J. Carlstrom et al. DES and SPT cover the same area of sky Self calibration Mass function shape allows independent checks Angular power spectrum of clusters Allows an approach at systematic error reduction Cluster Masses Optical Lensing Mass SZ X-ray
Locate peaks in the density field using cluster finders Red sequence methods SZ peaks DES will Image 5000 sq-degrees Photo-z accuracy z = 0.01 to z = 1 20,000 massive clusters 200,000 groups and clusters Low mass High mass Very massive 13.7 log M < 14.2 14.2 log M 14.5 log M Planck LSST SNAP SDSS WMAP 2005 2010 2020 2000 2015 DES Cluster Counting N z z = 0 1 3 PanStarrs
We aim at ~5% precision on Dark Energy Weak Lensing Cluster Counting Supernova w w w M DE M w ~ 5% and DE ~ 3% The Planck satellite will provide tighter input CMB measurements, and the constraints will improve slightly. Joint constraints on w and wa are promising: initial results suggest wa ~ 0.5.
We propose the Dark Energy Survey Construct a 500 Megapixel camera Use CTIO 4m to image 5000 sq-degrees Map the cosmological density field to z=1 Make precision measurements of the effects of Dark Energy on cosmological expansion: Cluster counting Weak lensing Galaxy clustering Supernovae The Dark Energy Survey 5000 sq-degrees Overlapping SPT SZ survey 4 colors for photometric redshifts 300 million galaxies
Design of the Dark Energy Survey James Annis Brenna Flaugher for the DES Collaboration BIRP Meeting August 12, 2004 Tucson Fermilab, U Illinois, U Chicago, LBNL, CTIO/NOAO
Science Goals to Science Objective • To achieve our science goals: • Cluster counting to z > 1 • Spatial angular power spectra of galaxies to z = 1 • Weak lensing, shear-galaxy and shear-shear • 2000 z<0.8 supernova light curves • We have chosen our science objective: • 5000 sq-degree imaging survey • Complete cluster catalog to z = 1, photometric redshifts to z=1.3 • Overlapping the South Pole Telescope SZ survey • 30% telescope time over 5 years • 40 sq-degree time domain survey • 5 year, 6 months/year, 1 hour/night, 3 day cadence Brenna Flaugher for the DES Collaboration BIRP Meeting August 12, 2004 Tucson Fermilab, U Illinois, U Chicago, LBNL, CTIO/NOAO
DARK ENERGY SURVEY (DES) Science Goal: measure w=p/ρ, the dark energy equation of state, to a precision of δw ≤ 5%, with • Cluster Survey • Weak Lensing • Galaxy Angular Power Spectrum • Supernovae Brenna Flaugher for the DES Collaboration BIRP Meeting August 12, 2004 Tucson Fermilab, U Illinois, U Chicago, LBNL, CTIO/NOAO
DES: Requirements Science Goals Science Requirements • Cluster Survey • Weak Lensing • Galaxy Angular Power Spectrum • Supernovae redshifts, area, filters, limit mag, red image quality, area photometry, area, limit mag repeat, area, filters, red Brenna Flaugher for the DES Collaboration BIRP Meeting August 12, 2004 Tucson Fermilab, U Illinois, U Chicago, LBNL, CTIO/NOAO
5000 sq-degrees Significantly overlapping the SPT SZ survey area To be completed in 5 years with a 30% duty cycle 4 bandpasses covering 390 to 1100 nm SDSS g,r,i,z z modified with Y cutoff Limiting magnitudes g,r,i,z = 24,24,24,23.6 10σ for small galaxies Photometric calibration to 2% 1% enhanced goal Astrometric calibration to 0.1” Point spread function Seeing < 1.1” FWHM Median seeing <= 0.9” g-band PSF can be 10% worse Stable to 0.1% over 9 sq-arcminute scales From chapter 3 of NOAO proposal; version 3 of requirements. Version 4, under review, will be a formal science requirements document. Science Requirements Brenna Flaugher for the DES Collaboration BIRP Meeting August 12, 2004 Tucson Fermilab, U Illinois, U Chicago, LBNL, CTIO/NOAO
Limiting Magnitude Red Galaxy Limiting magnitude (10σ for small galaxies) was set by flow down of science goals: • ½ L* cluster galaxies at redshift 4000A break leaving blue filter • g,r,i,z = 22.8,23.4,24.0,23.3 • Complete cluster catalog • Galaxy catalog completeness • g,r,i,z = 22.8,23.4,24.0,23.6 • Simple selection function • Blue galaxy photo-z at faint mags • g,r,i,z = 24.0,24.0,24.0,23.6 • Photo-z for angular power spectra and weak lensing Mag of ½ L* galaxy 0 redshift 1.5 i = 23-24 photo-z – spectro-z Brenna Flaugher for the DES Collaboration BIRP Meeting August 12, 2004 Tucson Fermilab, U Illinois, U Chicago, LBNL, CTIO/NOAO 0 redshift 1.5
Galaxy Cluster Redshifts four filters (griz) track 4000 Å break. Need z band filter to get out to redshift >~ 1 • the distribution of the number of clusters as a function of redshift is sensitive to the dark energy equation of state parameter, w. Theory • DES data will enable cluster photometric redshifts with dz~0.02 for clusters out to z~1.3 for M > 2x10¹⁴ M Brenna Flaugher for the DES Collaboration BIRP Meeting August 12, 2004 Tucson Fermilab, U Illinois, U Chicago, LBNL, CTIO/NOAO
Photometric Redshifts Red galaxies Resulting limiting magnitudes give very good photometric redshifts • Monte Carlo simulations of photometric redshift precision • Evolving old stellar pop. SED • Redshifted and convolved with filter curves. Noise added. • Polynomial fit to photo-z • For clusters, averaging all galaxies in the cluster above limiting magnitude. • Template fit for photo-z • These are sufficient to achieve our science goals. ½ L* 2 L* Clusters 1.0x10¹⁴ M0 Brenna Flaugher for the DES Collaboration BIRP Meeting August 12, 2004 Tucson Fermilab, U Illinois, U Chicago, LBNL, CTIO/NOAO
Overlap target Right Ascension (deg) Declination (deg) Area (sq. deg.) SPT -60 to 105 -75 to -60 -30 to -65 -45 to –65 4000 SDSS Stripe 82 -50 to 50 -1.0 to 1.0 200 Connection region 20 to 50 -30 to –1.0 800 The Footprint Requirements • Overlap with SPT SZ survey • Redshift survey overlap Footprint • -60 <= Dec <= -30 • SDSS Stripe 82 + VLT surveys DIRBE dust map, galactic coordinates Brenna Flaugher for the DES Collaboration BIRP Meeting August 12, 2004 Tucson Fermilab, U Illinois, U Chicago, LBNL, CTIO/NOAO
Survey Strategy I • Design decision 1: area is more important than depth • Image the entire survey area multiple times • Design decision 2: tilings are important for calibration • An imaging of the entire area is a tiling • Multiple tilings are a core means of meeting the photometric calibration requirement: offset tilings, not dithers • Design decision 3: substantial science with year 2 data • We will aim for substantial science publications jointly with the public release of the year 2 data. Brenna Flaugher for the DES Collaboration BIRP Meeting August 12, 2004 Tucson Fermilab, U Illinois, U Chicago, LBNL, CTIO/NOAO
Year 2 g,r,i,z 100 sec exposures g,r,i,z =24.6, 24.1, 23.6, 23.0 Calibration: abs=2.5% rel=1.2% Clusters to z=0.8 Weak lensing at 12 gals/sq-arcmin Year 5 z 400 sec exposures g,r,i,z =24.6, 24.1, 24.3, 23.9 Calibration: abs=<2% rel=<1% Clusters to z=1.3 Weak lensing at 28 gals/sq-arcmin Two tilings/year/bandpass In year 1-2, 100 sec/exp In year 3, drop g,r and devote time to i,z: 200 sec/exp In year 5, drop i and devote time to z: 400 sec/exp If year 1 or 2 include an El Nino event, we lose ~1 tiling, leaving three tilings at the end of year 2. This is sufficient to produce substantial key project science. Survey Strategy II Brenna Flaugher for the DES Collaboration BIRP Meeting August 12, 2004 Tucson Fermilab, U Illinois, U Chicago, LBNL, CTIO/NOAO
September: 4 bright+ 4 dark nights 22 nights October: 4 bright+ 5 dark nights 22 nights November: 4 bright+ 4 dark nights 22 nights December: 4 bright+ 4 dark nights 21 nights Telescope shut down Dec 25, 31 January: 4 bright+ 5 dark nights 11 nights and the 2nd half of all nights February: 3 bright+ 3 dark nights 11 nights and the 2nd half of all nights March – August all none Total 257 nights 108 nights DES Time Allocation Model Time to the Communityand to the Dark Energy Survey Brenna Flaugher for the DES Collaboration BIRP Meeting August 12, 2004 Tucson Fermilab, U Illinois, U Chicago, LBNL, CTIO/NOAO
CTIO mean weather year Time Allocation • Analytic calculation of time available • 30 year CTIO weather statistics • 5 year moving averages • Calculate photometric time • Can complete imaging survey and time domain survey with 3 sq-degree field of view camera • Simulations of observing process • Use mean weather year • Survey geometry • Observing overhead • NOAO time allocation model • High probability of completing core survey area in time allocated => DES time allocation model just sufficient to achieve science objective. Probability of obtaining 8 tilings per year over survey area. Dark is 100%, light yellow ~50% Brenna Flaugher for the DES Collaboration BIRP Meeting August 12, 2004 Tucson Fermilab, U Illinois, U Chicago, LBNL, CTIO/NOAO
Calibrate system response Convolve calibrated spectrum with system response curves to predict colors to 2% Dedicated measurement response system integrated into instrument Absolute calibration Absolute calibration should be good to 0.5% Per bandpass: magnitudes, not colors Given flat map, the problem reduces to judiciously spaced standard stars Relative calibration Photometry good to 2% Per bandpass: mags, not colors Use offset tilings to do relative photometry Multiple observations of same stars through different parts of the camera allow reduction of systematic errors Hexagon tiling: 3 tilings at 3x30% overlap 3 more at 2x40% overlap Aim is to produce rigid flat map of single bandpass Check using colors Stellar locus principal colors Photometric Calibration Strategy Brenna Flaugher for the DES Collaboration BIRP Meeting August 12, 2004 Tucson Fermilab, U Illinois, U Chicago, LBNL, CTIO/NOAO
We plan a full scale simulation effort Led by Huan Lin Centered at Fermilab and Chicago Using analytic, catalog and full image simulation techniques Over 4 years Underway, starting with photometric redshift simulations Use the simulations in 3 ways: Check reduction code Mock data reduction challenge Chris Stoughton Prepare analysis codes Mock data analysis challenge Josh Frieman Prepare for science Survey simulations Jim Annis Catalog level simulations Lin, Frieman, students for photo-z and galaxy distributions Risa Weschler’s Hubble Volume n-body Albert Stebbins’s multi-gaussian approximation Mike Gladder’s empirical halo model Image level simulations Erin Sheldon for weak lensing Doug Tucker and Chris Stoughton Terapix skyMaker Massey’s Shapelets code Survey Simulation Brenna Flaugher for the DES Collaboration BIRP Meeting August 12, 2004 Tucson Fermilab, U Illinois, U Chicago, LBNL, CTIO/NOAO
Survey Planning Summary • We have well defined science goals and a well defined science objective • A 5000 sq-degree survey substantially overlapping the SPT survey • A time domain survey using 10% of time • The science requirements are achievable. • A good seeing, 4 bandpass, 2% calibration, i ~ 24 survey • Multiple tilings of the survey area the core of the survey strategy and photometric calibration. • The survey can be completed using: • 22 nights a month between September and October • 21 nights in December • 22 half nights a month in January and February Brenna Flaugher for the DES Collaboration BIRP Meeting August 12, 2004 Tucson Fermilab, U Illinois, U Chicago, LBNL, CTIO/NOAO
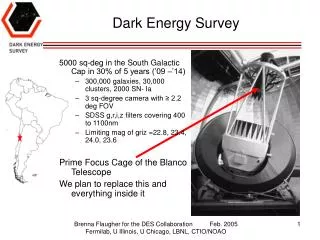
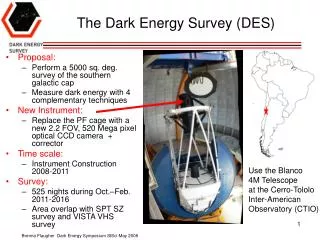
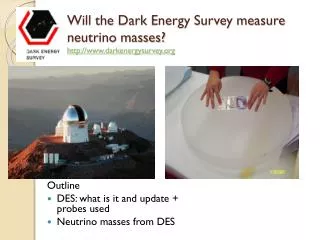
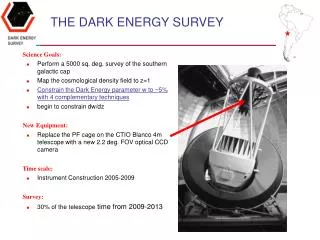
DES Instrument Project OUTLINE • Science and Technical Requirements • Instrument Description • Cost and Schedule Prime Focus Cage of the Blanco Telescope We plan to replace this and everything inside it Brenna Flaugher for the DES Collaboration BIRP Meeting August 12, 2004 Tucson Fermilab, U Illinois, U Chicago, LBNL, CTIO/NOAO
DES Instrument Reference Design Instrument Construction Organization 1.2.1 CCDs 1.2.2 CCD Packaging 1.2.3 Front End Electronics 1.2.4 CCD Testing 1.2.5 Data Aquisition 1.2.6 Camera Vessel 1.2.7 Cooling 1.2.8 Optics 1.2.9 Prime Focus Cage 1.2.10 Auxiliary Components 1.2.11 Assembly and Testing 3556 mm Camera Scroll Shutter 1575 mm Filters The Reference Design represents our current design choices and may change with more analysis Optical Lenses Brenna Flaugher for the DES Collaboration BIRP Meeting August 12, 2004 Tucson Fermilab, U Illinois, U Chicago, LBNL, CTIO/NOAO
Optics Design Corrector • 2.2 deg. FOV Corrector • 5 powered elements (Fused Silica) • one aspheric surface (C4) • four filters – griz needed for DES • others can be used • More details of the design in the next talk (Steve Kent) • Cost for the glass ~ 660k$ • Cost for figuring ~ $1M • ~ 1.5 yr delivery Brenna Flaugher for the DES Collaboration BIRP Meeting August 12, 2004 Tucson Fermilab, U Illinois, U Chicago, LBNL, CTIO/NOAO
2.2 Deg. Field of View Corrector Requirements Performance Issues Dark Energy Survey:Optical Design and Issues Steve Kent, Fermilab, for the DES Collaboration Dark Energy Survey BIRP, Aug 12, 2004 Brenna Flaugher for the DES Collaboration BIRP Meeting August 12, 2004 Tucson Fermilab, U Illinois, U Chicago, LBNL, CTIO/NOAO
2.2 Deg. Field of View Corrector • 14 requirements total • 0.39 to 1.1 μ (SDSS filter bandpasses) • Scale 17.7 arcsec/mm • Field size 450 mm diameter (2.2 degrees) • D80 < 0.64 arcsec everywhere (FWHM < .4 arcsec) • No ADC (Atmospheric Dispersion Corrector) • Minimize ghosting • Space for filter, shutter • Design choices should minimize procurement, fabrication schedule. Brenna Flaugher for the DES Collaboration BIRP Meeting August 12, 2004 Tucson Fermilab, U Illinois, U Chicago, LBNL, CTIO/NOAO
Gladders may11 design Features: • Flat focal plane • Five lenses + Filter • (including dewar window) • All fused silica • One aspheric surface • Largest diameter 1.1 meters • Flexibility spacing elements • Low distortion (<1%) • Good ghosting properties • star halos • exit pupil image C5 Shutter C4 Filter Filter C3 C2 C1 Brenna Flaugher for the DES Collaboration BIRP Meeting August 12, 2004 Tucson Fermilab, U Illinois, U Chicago, LBNL, CTIO/NOAO
CCDs • Reference Design: LBNL CCDs • QE> 50% at 1000 nm • 2k x 4k • 15 micron pixels • 250 microns thick • fully depleted (high resistivity) • back illuminated • 4 side buttable • readout 250 kpix/sec • 2 RO channels/device • readout time ~17sec • fringing eliminated • PSF controlled by bias voltage R&D on LBNL CCDs nearly finished. LBNL CCDs have been used at LICK and on the WIYN Telescope and on the Mayall Brenna Flaugher for the DES Collaboration BIRP Meeting August 12, 2004 Tucson Fermilab, U Illinois, U Chicago, LBNL, CTIO/NOAO
CCD QE and Read noise To get redshifts of ~1 we spend ~50% of survey time in z-band. LBNL CCDs are much more efficient in the z band than the current devices in Mosaic II Read noise for a recently finished DALSA 2k x 4k 250 kHz → 7e- Brenna Flaugher for the DES Collaboration BIRP Meeting August 12, 2004 Tucson Fermilab, U Illinois, U Chicago, LBNL, CTIO/NOAO
CCD Acquisition Model Reference Design Acquisition Model • Order CCDs through LBNL – good relationship with commercial foundry • Foundry delivers wafers to LBNL (~650 microns thick) • LBNL • applies backside coatings for back illuminated operation • oversees thinning (~ 250 microns thick) and dicing • tests all devices on cold probe station • LBNL delivers all tested, unpackaged devices to FNAL • FNAL packages and tests CCDs • Prepared to package ~ 160 CCDs (spares, yield) • CCD Wafers: • Existing masks have 2/wafer • to be cost efficient we will make new masks with 4/wafer Brenna Flaugher for the DES Collaboration BIRP Meeting August 12, 2004 Tucson Fermilab, U Illinois, U Chicago, LBNL, CTIO/NOAO
Packaging • CCD Packaging will be done at Fermilab • LICK and LBNL have already successfully packaged small quantities. • We are developing a working relationship with R. Stover at LICK (we visited in July) to learn packaging techniques Invar Foot CCD packaged at LBNL AlN circuit board Wirebonds to CCD CCD Packaging is very similar to building the components of silicon vertex detectors. Fermilab has built many vertex detectors for CDF and D0, and is contributing to CMS Brenna Flaugher for the DES Collaboration BIRP Meeting August 12, 2004 Tucson Fermilab, U Illinois, U Chicago, LBNL, CTIO/NOAO
Packaging and Testing Process • Packaging and testing keep up with anticipated CCD delivery rate of 20/month (5 wafers). • Packaging: • one CCD takes ~ 1 week to complete • Plan to have capabilities to start 2/day • Testing: • estimate 2 days/CCD • 3 identical test stands needed to keep up with 5 CCDs/week • LBNL cold probe test results will guide which CCDs to package 1st • Assume 60 good devices from production run and up to 18 good devices from preproduction run Brenna Flaugher for the DES Collaboration BIRP Meeting August 12, 2004 Tucson Fermilab, U Illinois, U Chicago, LBNL, CTIO/NOAO
CCD Test Stand and Acceptance Criteria • Testing • linearity, full well depth, QE, CTE, readnoise, dark current • Testing and acceptance criteria will be defined as we gain experience with LBNL CCDs • Will also consider impact of acceptance criteria on community • Multiple tilings reduces impact of bad regions • Study with 100 consecutive bad columns found ~1.5% of tiling area was imaged less than 3 times after 5 complete tilings Brenna Flaugher for the DES Collaboration BIRP Meeting August 12, 2004 Tucson Fermilab, U Illinois, U Chicago, LBNL, CTIO/NOAO
Camera Reference Design Focal Plane Camera Design feed through board 62 2k x 4k CCDs for main image, 4-side buttable, 15 micron pixels 8 1k x 1k CCDs for guiding and focus Frontend electronics Focal Plane Brenna Flaugher for the DES Collaboration BIRP Meeting August 12, 2004 Tucson Fermilab, U Illinois, U Chicago, LBNL, CTIO/NOAO
Camera Vessel Cooling/ Vacuum spool piece Camera is separated into two spool pieces: one for signal feed throughs one for cooling and vacuum services Removal of cooling spool piece allows access to back of focal plane and cables • Vacuum feed through board brings signals out of cryostat Brenna Flaugher for the DES Collaboration BIRP Meeting August 12, 2004 Tucson Fermilab, U Illinois, U Chicago, LBNL, CTIO/NOAO
Cooling and Integration • Reference Design has LN2 reservoir inside cryostat • Fill from recondensing dewars on floor • investigating alternative: Gifford-McMahon cryo coolers on cooling spool piece which condense N2 directly into reservoir Will fully assemble prime focus cage at FNAL and test all systems together (corrector, focal plane, cooling, data acquisition, data management....) before shipping to Chile Brenna Flaugher for the DES Collaboration BIRP Meeting August 12, 2004 Tucson Fermilab, U Illinois, U Chicago, LBNL, CTIO/NOAO