Download
1 / 23
230 likes | 247 Vues
Precision measurements of Dark Energy through cluster counting, weak lensing, and supernovae. Mapping the cosmological density field to z=1 with 300 million galaxies spread over 5000 sq-degrees using new instrumentation. Confirms dark energy and addresses major holes in our understanding of fundamental physics.

E N D
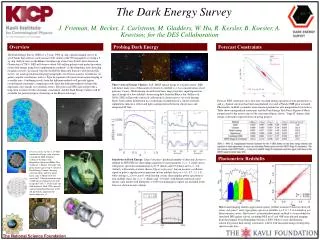
The Science Case for the Dark Energy Survey James Annis For the DES Collaboration
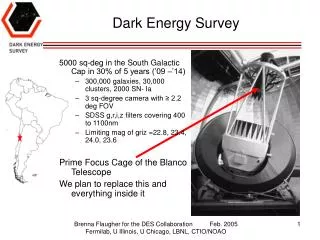
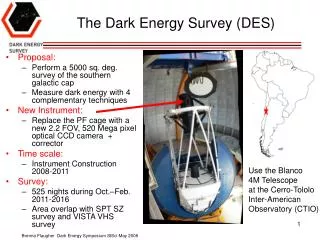
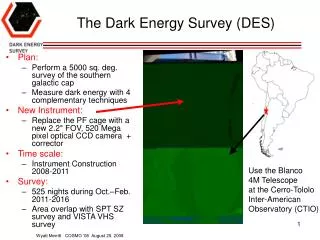
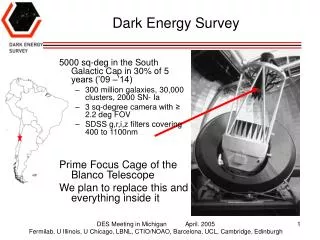
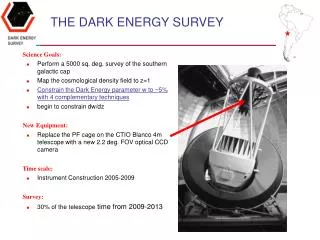
We propose to make precision measurements of Dark Energy Cluster counting, weak lensing and supernovae Independent measurements by mapping the cosmological density field to z=1 Measuring 300 million galaxies Spread over 5000 sq-degrees using new instrumentation of our own design. 500 Megapixel camera 2.1 degree field of view corrector Install on the existing CTIO 4m The Dark Energy Survey
Cosmology in 2004 Sloan Digital Sky Survey measures the galaxy density field at z < 0.3 WMAP measures the CMB radiation density field at z=1000 • Combine to measure parameters of cosmology to 10%. • We enter the era of precision cosmology. • Confirms dark energy (!) 2003 Science breakthrough of the year
Dark energy? Who ordered that? (said Rabi about muons) Dark energy is the dominant constituent of the Universe Dark matter is next The Big Problems: Dark Energy and Dark Matter The confirmation of Dark Energy points to major holes in our understanding of fundamental physics 95% of the Universe is in forms unknown to us 1998 Science breakthrough of the year
Dark Energy • The Cosmological Constant Problem Particle physics theory currently provides no understanding of why the vacuum energy density is so small: DE(Theory) /DE(obs) = 10120 • The Cosmic Coincidence Problem Theory provides no understanding of why the Dark Energy density is just now comparable to the matter density. • What is it? Is dark energy the vacuum energy? a new, ultra-light particle? a breakdown of General Relativity on large scales? Evidence for extra dimensions? The nature of the Dark Energy is one of the outstandingunsolved problems of fundamental physics. Progress requires more precise probes of Dark Energy.
Measuring Dark Energy • One measures dark energy through how it affects the universe expansion rate, H(z): H2(z) = H20 [ M (1+z) 3 + R (1+z) 4 + DE (1+z) 3 (1+w) ] matter radiation dark energy • Note the parameter w, which describes the evolution of the density of dark energy with redshift. A cosmological constant has w = 1. w is currently constrained to ~20% by WMAP, SDSS, and supernovae • Measurements are usually integrals over H(z) r(z) = dz/H(z) • Standard Candles (e.g., supernova) measure dL(z) = (1+z) r(z) • Standard Rulers measure da(z) = (1+z)1 r(z) • Volume Markers measure dV/dzd = r2(z)/H(z) • The rate of growth of structure is a more complicated function of H(z)
DES Dark Energy Measurements • New Probes of Dark Energy • Galaxy Cluster counting • 20,000 clusters to z=1 with M > 2x10¹⁴ M • Weak lensing • 300 million galaxies with shape measurements • Spatial clustering of galaxies • 300 million galaxies • Standard Probes of Dark Energy • Type 1a Supernovae distances • 2000 supernovae
Type 1a Supernovae magnitudes and redshifts provide a direct means to probe dark energy Standard candles DES will make the next logical step in this program: Image 40 sq-degree repeatedly 2000 supernovae at z < 0.8 Well measured light curves 2005 2010 2020 2000 2015 Supernova Current projects Essence CFHLS SCP SDSS PanStarrs LSST SNAP Proposed projects DES
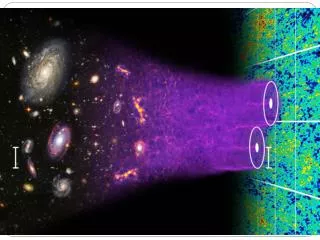
Rely on mapping the cosmological density field Up to the decoupling of the radiation, the evolution depends on the interactions of the matter and radiation fields - ‘CMB physics’ After decoupling, the evolution depends only on the cosmology - ‘large-scale structure in the linear regime’. Eventually the evolution becomes non-linear and complex structures like galaxies and clusters form - ‘non-linear structure formation’. New Probes of Dark Energy z = 0 z = 30
Planck LSST SNAP SDSS WMAP 2005 2010 2020 2000 2015 DES Spatial Clustering of Galaxies • The distribution of galaxy positions on the sky reflects the initial positions of the mass • Maps of galaxy positions are broken up in photometric redshift bins • The spatial power spectrum is computed and compared with the CMB fiducial power spectrum. • The peak and the baryon oscillations provide standard rulers. • DES will • Image 5000 sq-degrees • Photo-z accuracy of z < 0.1 to z = 1 • 300 million galaxies PanStarrs Cooray, Hu, Huterer, Joffre 2001
Weak lensing is the statistical measurement of shear due to foreground masses A shear map is a map of the shapes of background galaxies Dls distance from lens to source Background galaxy shear maps Lensing galaxies Dl distance to lens Light path Ds distance to source Weak Lensing
The strength of weak lensing by the same foreground galaxies varies with the distance to the background galaxies. Measure amplitude of shear vs. z shear-galaxy correlations shear-shear correlations DES will Image 5000 sq-degrees Photo-z accuracy of z < 0.1 to z = 1 10-20 galaxies/sq-arcminute Shear maps(z) Galaxy map z = 3/4 z = 1/2 z = 1/4 Planck LSST SNAP SDSS WMAP 2005 2010 2020 2000 2015 DES Weak Lensing PanStarrs DeepLens CFHLS
Clusters of galaxies are peaks of the density field. Dark energy influences the number and distribution of clusters and how they evolve with time. Peaks in the Density Field 16 Mpc 2 Mpc
Our mass estimators Galaxy count/luminosity Weak lensing Sunyaev-Zeldovich The South Pole Telescope project of J. Carlstrom et al. DES and SPT cover the same area of sky Self calibration Mass function shape allows independent checks Angular power spectrum of clusters Allows an approach at systematic error reduction Cluster Masses Optical Lensing Mass SZ X-ray
Locate peaks in the density field using cluster finders Red sequence methods SZ peaks DES will Image 5000 sq-degrees Photo-z accuracy z = 0.01 to z = 1 20,000 massive clusters 200,000 groups and clusters Low mass High mass Very massive 13.7 log M < 14.2 14.2 log M 14.5 log M Planck LSST SNAP SDSS WMAP 2005 2010 2020 2000 2015 DES Cluster Counting N z z = 0 1 3 PanStarrs
We aim at ~5% precision on Dark Energy Weak Lensing Cluster Counting Supernova w w w M DE M w ~ 5% and DE ~ 3% The Planck satellite will provide tighter input CMB measurements, and the constraints will improve slightly. Joint constraints on w and wa are promising: initial results suggest wa ~ 0.5.
We propose the Dark Energy Survey Construct a 500 Megapixel camera Use CTIO 4m to image 5000 sq-degrees Map the cosmological density field to z=1 Make precision measurements of the effects of Dark Energy on cosmological expansion: Cluster counting Weak lensing Galaxy clustering Supernovae The Dark Energy Survey 5000 sq-degrees Overlapping SPT SZ survey 4 colors for photometric redshifts 300 million galaxies
Sunyaev-Zeldovich Effect Scattering moves photons from lowfrequencies (RJ part of the frequency spectrum) to high frequencies (Wien regime) In the language of Sunyaev-Zel’dovich (1980): A. Cooray Frequency shift the CMB blackbody and the difference (wrt to CMB)
MaxBcg Galaxy Cluster Finding z = 0.06 z = 0.13 z = 0.20 Likelihood= 1.9 Likelihood= -7.8 Likelihood= -8.4 N=0 N=19 N=0