Download
1 / 16
160 likes | 262 Vues
Future Risk of Global Drought from Downscaled, Bias Corrected Climate Projections Eric F. Wood, Justin Sheffield, Haibin Li Princeton University WCRP-UNESCO (GEWEX/CLIVAR/IHP) Workshop on Metrics and methodologies of estimation of extreme climate events 27-29 September 2010 UNESCO, Paris.

E N D
Future Risk of Global Drought from Downscaled, Bias Corrected Climate Projections Eric F. Wood, Justin Sheffield, Haibin Li Princeton University WCRP-UNESCO (GEWEX/CLIVAR/IHP) Workshop on Metrics and methodologies of estimation of extreme climate events 27-29 September 2010 UNESCO, Paris
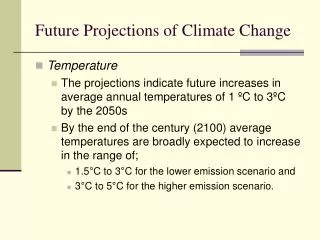
Background • Understanding how changes in drought conditions will develop in the 21st century, including changes in severity, extent, and duration, is of great importance to many sectors (water resources management and agricultural) and many related extremes (wildfire, heat waves.) • Recent severe droughts in Russia, the Western U.S., southeast Australia, Eastern Africa, Europe and northern China are testament to the impacts that large scale drought can have and are perhaps indicators of things to come. Aerosol Optical Thickness August 2010 Land Temperature Anomaly (oC)
Background: Future Climate Model Projections of Drought Projections of drought from climate models show decreasing soil moisture globally and increases in drought frequency, severity, duration and spatial extent. But there are large uncertainties in future projections, derived from emission scenarios and climate models, especially at regional scales. Vol Soil Moisture 20C3M Drought extent SRESB1 Num 4-6 Months SRESA1B Num >12 Months Mean Severity SRESA2 Sheffield and Wood, 2008
The Problem The direct use of climate model outputs for analysis of future drought is problematic because of known model biases, particularly model simulated precipitation that has first order impacts on drought. GCM soil moisture drought statistics (error bars) versus off-line modeling (dots) (Sheffield and Wood, 2008) GCM precipitation RMS errors in the Northern Hemisphere extra-tropics (Glecker et al., JGR, 2008)
Proposed Method for Assessing Future Drought Risk Future drought conditions globally based on simulations using the Variable Infiltration Capacity (VIC) land surface model (LSM) Forced by downscaled, bias corrected climate projections using a new equidistant quantile matching method, which takes into account changes in the future climate distribution and better represents extreme years that are most associated with drought. An improvement upon traditional quantile matching methods. We demonstrate the application with a single climate model (Li et al., 2010). The bias corrected and downscaled climate forcings are used to drive the LSM to generate future projections of the terrestrial water and energy cycles. These outputs are then analyzed to understand the propagation of projected drought, including frequency and severity, and to compare these projections with analyses based on 20th C observations.
Global Forcing Dataset High temporal/high spatial resolution, bias corrected, trend corrected, etc… Input Parameters VIC Land Surface Hydrology Model Precipitation Elevation Vegetation Temperature Soils Radiation Land Surface Hydrologic Model Simulations Simulations: 1. Observation forced simulation that represents our best estimate of historic hydrology for 1948-2008. 2. Future climate simulation for 1948-2099 forced with bias corrected and downscaled climate model data for the 20C3M (20thC) and SRESA2 (21stC) future scenarios from the NCAR-PCM climate model. • Global land except Antarctica/Greenland • 1.0 degree grid resolution
Evaluation of Land Surface Model Hydrology • VIC was calibrated against spatially disaggregated streamflow from 25 large basins across the world. • Evaluations have been carried out for evapotranspiration (against satellite remote sensing estimates and inferred estimates from atmospheric reanalyses), soil moisture (against point measurements from around the world), snow cover (against remote sensing estimates for the northern hemisphere) and total land water storage anomalies (against GRACE satellite retrievals). Evapotranspiration Total Water Storage Streamflow
Statistical Bias Correction of Climate Model Projections • Involves establishing a statistical relationship (transfer function) between model and observations, then applying the transfer function to future model projections. • CDF matching method (CDFm) maps a model value and an observed value via the CDF. Advantage: adjusts all moments while maintaining the rank correlation between models and observations. Assumes that the climate distribution does not change over time. • New method called Equidistant CDF matching (EDCDFm) • Allows for changes in the shape of the future climate distribution. • Model projection is adjusted by the difference between the projection mapped to the observed climate and that mapped to the model climate. (Li, Sheffield and Wood, JGR, 2010) CDFm EDCDFm
Climate Model Biases The model has a cool bias in temperatures and spatially and seasonally varying high and low biases in precipitation. Northern Eurasia Temperature (K) July Precipitation (mm/month) July Mean Sdev Skew Obs (1970-99) Obs (1970-99) Model (1970-99) Model (2070-99) Model (1970-99) Model (2070-99)
Precipitation (mm/month) January Bias Correction of Precip and Temp. CDFm- Obs Model - Obs EDCDFm- Obs (right) For the 25, 50, and 75th percentiles the difference between the two methods is indistinguishable. 25th percentile 50th percentile 75th percentile Temperature (K) January: EDCDFm - CDFm 1st percentile 5th percentile 25th percentile (left) Differences in the projections for the high and low percentiles are up to 1K in the percentiles for January temperature. EDCDFm has a narrower distribution (warmer lower percentiles and cooler upper percentiles), reflecting the method’s adjustment to the larger variability in the current climate and a reduced variability in future projections. 99th percentile 95th percentile 75th percentile
Future Changes in P, T, Radiation and other Meteorology The bias correction is applied also to monthly radiation, humidity and windspeed to capture changes and interplay among these associated drivers. Precipitation (mm/m) Temperature (K) (right) Global time series of the original climate projections (black lines) show increases in precipitation, temperature , longwave radiation and humidity. Bias corrected variables (red lines) reflect the often large biases in many variables. Down SW (W/m2) Down LW (W/m2) (Below) Despite global increases in precipitation, regional drying is evident in many regions (Annual trend in P (mm/month/y) 2000-2099) Specific humidy (g/g) Diurnal T Range (K) Max Temperature (K) Min Temperature (K) Wind speed (m/s) Surf. Pressure (Pa) -0.25 0 0.25
Soil Moisture Percentiles (%), Drought Spatial Extent (%) 2075 2075 2075 2025 2025 2025 1975 1975 1975 Future Changes in Global and Regional Soil Moisture and Drought Area • Drought is quantified in terms of soil moisture percentiles below a threshold. • The figure shows time series for the late 20th and 21st centuries for the world and different regions. • Mean soil moisture increases globally, drought area also increases because of regional drying, permafrost melting and increased persistence of extreme low soil moisture values (increased variability). Regions used for drought analysis
Severity-Area-Duration (SAD) Analysis (see Andreadis et al., 2005 J Hydromet.; Sheffield et al., 2009 J Climate for more details)
1950-1999 Obs. 2000-2049 Model 1950-1999 Model2050-2090 Model Future Large Scale Drought Events Severity-area-duration (SAD) curves for individual large scale drought events for Europe Individual drought events are identified from a SAD analysis, which follows drought development through time and space and identifies the severest events • The observation-based and climate model driven 20th century curves show similar severity and area extent. • The 21st century curves are generally more severe and more extensive, peaking at 8 million km2. • By late 21st century the projection shows a number of large scale droughts that last longer than 24 months. • No droughts are identified that last for more than 48 months20 12 mon 3 mon 48 mon 24 mon
Central European Heatwave, 2003 Northwest Europe, 1976 Future Large Scale Drought Events Peak of mid- and late 21st century European drought events cover large part of the continent Severity (%) Compare with reconstructions of historic events: Severity (%)
Summary • Previous future global drought analyses directly used climate model output, which can result in large errors in derived impacts (e.g. projected impacts on agricultural or water resources). • Removing the biases associated with climate model simulations, and downscaling to higher spatial resolution, will improve drought projections and related impacts. • In our research, we use a statistical Equidistant CDF matching (EDCDFm) approach to bias correct and downscale 20th C and 21st C climate projections, a comprehensive land surface model to generate global soil moisture dynamics and a severity-area-duration analysis to assess global drought. • The LSM and biased corrected, downscaled projections can be (should be?) used for climate change impact assessments (e.g. Hayhoe et al. 2006 Climate Dynamics,28(4):381-407)