Download
1 / 53
540 likes | 1.07k Vues
Outline. Problem at handReminder: t-Test, multiple hypothesis testingSAM in detailsTest SAM's validityOther methods- comparisonVariants of SAM. . . Outline. Problem at handReminder: t-Test, multiple hypothesis testingSAM in detailsTest SAM's validityOther methods- comparisonVariants of SAM

E N D
1. Significance analysis of Microarrays (SAM) Applied to the ionizing radiation response SAM is a method that tries to identify changes in gene expression between different biological conditions,
and determine the significance of these changes (while accounting for an enormous number of genes).SAM is a method that tries to identify changes in gene expression between different biological conditions,
and determine the significance of these changes (while accounting for an enormous number of genes).
2. Outline Problem at hand
Reminder: t-Test, multiple hypothesis testing
SAM in details
Test SAM�s validity
Other methods- comparison
Variants of SAM
3. Outline Problem at hand
Reminder: t-Test, multiple hypothesis testing
SAM in details
Test SAM�s validity
Other methods- comparison
Variants of SAM
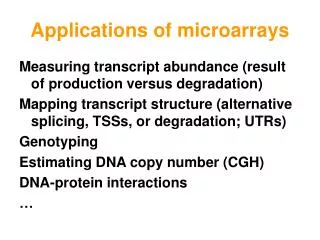
4. The Problem: Identifying differentially expressed genes
Determine which changes are significant
Enormous number of genes Massive amounts of data are generated in a single hybridization experiment.
Also, there is a lot of noise.Massive amounts of data are generated in a single hybridization experiment.
Also, there is a lot of noise.
5. Reminder: t-Test t-Test for a single gene:
We want to know if the expression level changed from condition A to condition B.
Null assumption: no change
Sample the expression level of the genes in two conditions, A and B.
Calculate
H0: The groups are not different, See http://mathworld.wolfram.com/Pairedt-Test.html for further details about t-Test.See http://mathworld.wolfram.com/Pairedt-Test.html for further details about t-Test.
6. t-Test Cont�d Under H0, and under the assumption that the data is normally distributed,
Use the distribution table to determine the significance of your results.
7. Multiple Hypothesis Testing Na�ve solution: do t-test for each gene.
Multiplicity Problem: The probability of error increases.
We�ve seen ways to deal with it, that try to control the FWER or the FDR.
Today: SAM (estimates FDR)
8. Outline Problem at hand
Reminder: t-Test, multiple hypothesis testing
SAM in details
Test SAM�s validity
Other methods- comparison
Variants of SAM
9. SAM- procedure overview SAM assigns a score to each gene on the basis of change in gene expression relative to the standard deviation.
For genes with scores greater than an adjustable threshold, SAM uses permutations of the measurements to estimate the FDR.SAM assigns a score to each gene on the basis of change in gene expression relative to the standard deviation.
For genes with scores greater than an adjustable threshold, SAM uses permutations of the measurements to estimate the FDR.
10. SAM- procedure overview
11. The Experiment
12. Scaling
Scale the data.
Use technique known as �linear normalization�
Twist- use cube root
13. First glance at the data
14. How to find the significant changes? Na�ve method
15. SAM- procedure overview
16. SAM�s statistic- Relative Difference Define a statistic, based on the ratio of change in gene expression to standard deviation in the data for this gene. See http://davidmlane.com/hyperstat/B58842.html for further details about s(i).See http://davidmlane.com/hyperstat/B58842.html for further details about s(i).
17. At low expression levels, variance in d(i) can be high, due to small values of s(i).
To compare d(i) across all genes, the distribution of d(i) should be independent of the level of gene expression and of s(i).
Choose s0 to make the coefficient of variation of d(i) approximately constant as a function of s(i). Why s0 ?
18. Choosing s0
19. We gave each gene a score.
At what threshold should we call a gene significant?
How many false positives can we expect? Now what?
20. SAM- procedure overview
21. More data required Experiments are expensive.
Instead, generate permutations of the data (mix the labels)
Can we use all possible permutations?
23. Balancing the Permutations
24. Balanced Permutations
26. SAM- procedure overview
27. Estimating d(i)�s Order Statistics
28. Example
29. SAM- procedure overview
30.
Plot d(i) vs. dE(i) :
For most of the genes,
Identifying Significant Genes
31. Define a threshold, ?.
Find the smallest positive d(i) such that Identifying Significant Genes
33. Where are these genes?
34. SAM- procedure overview
35. Estimate FDR t1 and t2 will be used as cutoffs.
Calculate the average number of genes that exceed these values in the permutations.
Very similar to the Gap Estimation algorithm for clustering, shown in a previous lecture.
Estimate the number of falsely significant genes, under H0:
Divide by the number of genes called significant
36. FDR cont�d
37. Example
38. How to choose ??
39. Test SAM�s validity 10 out of 34 genes found have been reported in the literature as part of the response to IR
19 appear to be involved in the cell cycle
4 play role in DNA repair
Perform Northern Blot- strong correlation found
Artificial data sets- some genes induced, background noise
40. SAM- procedure overview
41. Outline Problem at hand
Reminder: t-Test, multiple hypothesis testing
SAM in details
Test SAM�s validity
Other methods- comparison
Variants of SAM
42. Other Methods- Comparison R-fold Method:
Gene i is significant if r(i)>R or r(i)<1/R
FDR 73%-84% - Unacceptable.
Pairwise fold change: At least 12 out of 16 pairings satisfying the criteria. FDR 60%-71% - Unacceptable.
Why doesn�t it work?
43. Fold-change, SAM- Validation
45. Multiple t-Tests Trying to keep the FDR or FWER.
Why doesn�t it work?
FWER- too stringent (Bonferroni, Westfall and Young)
FDR- too granular (Benjamini and Hochberg)
SAM does not assume normal distribution of the data
SAM works effectively even with small sample size.
46. Clustering Coherent patterns
Little information about statistical significance
47. SAM Variants SAM with R-fold
48. SAM Variants cont�d
Other variants- Statistic is still in form
definitions of r(i), s(i) change.
Welch-SAM (use Welch statistics instead of
t-statistics)
Fisher�s linear discriminant- see the �Discrimination Methods� lectureFisher�s linear discriminant- see the �Discrimination Methods� lecture
49. SAM Variants cont�d SAM for n-state experiment (n>2)
define d(i) in terms of Fisher�s linear
discriminant.
(e.g., identify genes whose expression in
one type of tumor is different from the
expression in other kinds)
50. SAM Variants cont�d Other types of experiments:
Gene expression correlates with a quantitative parameter (such as tumor stage)
Paired data
Survival time
Many others
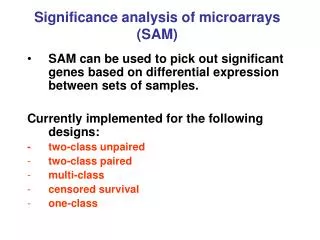
51. Summary SAM is a method for identifying genes on a microarray with statistically significant changes in expression.
Developed in a context of an actual biological experiment.
Assign a score to each gene, uses permutations to estimate the percentage of genes identified by chance.
Comparison to other methods.
Robust, can be adopted to a broad range of experimental situations.
52. Reference:
Significance analysis of microarrays applied to the ionizing radiation response \ Virginia Goss Tusher,Robert Tibshirani, and Gilbert Chu
Bibliography:
SAM Thresholding and False Discovery Rates for Detecting Differential Gene Expression in DNA Microarrays\ John D. Storey Robert Tibshirani
Statistical methods for ranking differentially expressed genes\ Per Broberg 2003
Assessment of differential gene expression in human peripheral nerve injury\ Yuanyuan Xiao, Mark R Segal, Douglas Rabert, Andrew H Ahn, Praveen Anand, Lakshmi Sangameswaran, Donglei Hu and C Anthony Hunt 2002
SAM �Significance Analysis of Microarrays� Users guide and technical document\ Gil Chu, Balasubramanian Narasimhan, Robert Tibshirani, Virginia Tusher
SAM\ Cristopher Benner
Statistical Design and analysis of experiments\ Mason, Gunst, Hess
http://www-stat-class.stanford.edu/SAM/servlet/SAMServlet
53. Thank You.